Figure 1.
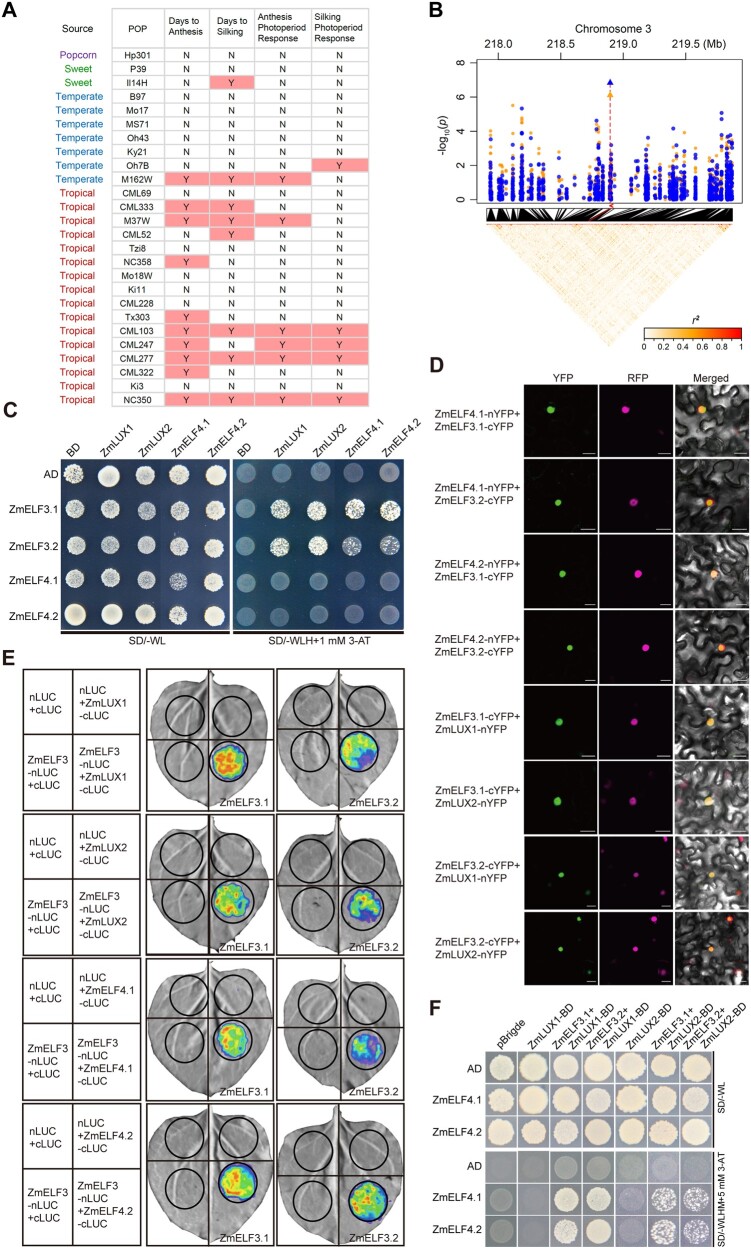
ZmELF3s bridge ZmELF4s and ZmLUXs to form the EC. A, Linkage mapping using the NAM population identifies a QTL for flowering time and photoperiod response around the ZmELF3.1 region. Y or N, with or without QTL detected around the ZmELF3.1 region. B, GWAS identification of ZmELF3.1 as a candidate gene for variation in the traits DTA and DTS. The candidate genes for DTA and DTS are marked with blue points and orange points, respectively. Peak markers are shown as triangles for each trait and their positions in the linkage disequilibrium heatmap are indicated by red lines. The position of the candidate gene in the Manhattan plot is shown by the red arrow. C, Y2H assay showing that ZmELF3.1/3.2 directly interact with both ZmELF4.1/4.2 and ZmLUX1/2. Three independent experiments showed similar results. D, BiFC assay showing that ZmELF3.1/3.2 directly interact with both ZmELF4.1/4.2 and ZmLUX1/2 in N. benthamiana leaf cells. The AHL22-ERFP marker was co-infiltrated to indicate the nuclei. The interaction between nYFP and ZmELF3-cYFP or between cYFP and ZmELF4-nYFP (or ZmLUX-nYFP) is shown in Supplemental Figure S3C as the negative controls. Scale bar, 20 μm. Three independent experiments were performed, with similar results. E, LCI assay demonstrating the interaction between ZmELF3.1/3.2 with ZmELF4.1/4.2 or ZmLUX1/2 in N. benthamiana leaves. Three independent experiments were performed, with similar results. Representative images of N. benthamiana leaves 72 h after infiltration are shown. F, Yeast three-hybrid assay showing that ZmELF3.1/3.2, ZmELF4.1/4.2 and ZmLUX1/2 interact to form a tri-protein complex(es) in yeast. Two independent experiments showed similar results.

