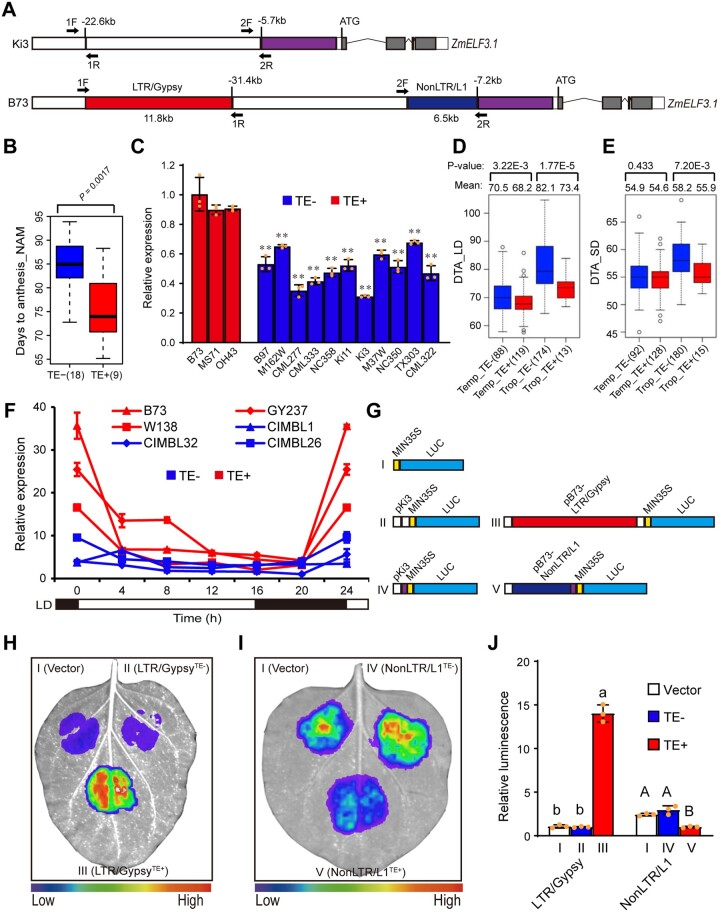
Figure 5.
The NonLTR/L1 retrotransposon and LTR/Gypsy retrotransposon regulate ZmELF3.1 expression. A, Schematic diagram of the locations of a NonLTR/L1-type retrotransposon (6.5 kb in length) and an LTR/Gypsy type retrotransposon (11.8 kb in length) in two representative inbred lines (B73 and Ki3). 1F/1R and 2F/2R indicate the primers used to construct the vectors in Figure 5G. B, Flowering time of the NAM founder lines with or without the retrotransposons. The flowering time data were obtained from the previous NAM flowering-time mapping study (Buckler et al., 2009). C, The relative expression levels of ZmELF3.1 in the NAM founder lines with retrotransposon insertion upstream of ZmELF3.1 promoter are significantly higher than in the NAM founder lines without retrotransposon insertion. Values are means ± SD (n = 3 biological replicates, leaves from six plants were used for each replicate). D and E, Flowering time of 415 maize inbred lines (Yang et al., 2014) with or without retrotransposons in the ZmELF3.1 promoter under LD (D) or SD (E) conditions. The number of inbred lines is indicated in brackets. F, The relative expression levels of ZmELF3.1 in inbred lines with retrotransposon insertion upstream of ZmELF3.1 promoter are significantly higher than in the inbred lines without retrotransposon insertion. Three independent experiments were performed, with similar results. G, Schematic diagrams of the constructs used to test the effect of the two retrotransposon elements on gene expression in transient expression assay in N. benthamiana leaves. H and I, The LTR/Gypsy retrotransposon strongly activates ZmELF3.1 expression while the NonLTR/L1 retrotransposon mildly inhibits ZmELF3.1 expression. Representative images of N. benthamiana leaves 72 h after infiltration are shown. Three independent experiments were performed, with similar results. J, Quantification of luminescence intensity in (H) and (I). Values are means ± SD (n = 3 biological replicates). Significant differences was determined by Duncan's multiple-range test in Fig. 5J and Student's t test in the others. Three independent experiments were performed, with similar results.

