Figure 6.
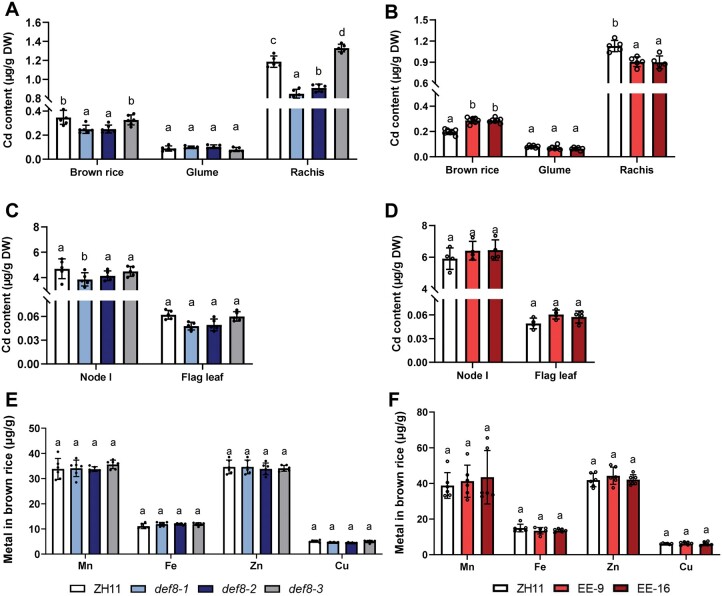
DEF8 mediates Cd distribution to rice grains. A–D, Cd contents in brown rice, glume, and rachis of def8 (A) and transgenic plants with EE of DEF8 (B), or in node I and flag leaves of def8 (C) and transgenic plants (D). E and F, Essential metal accumulation in brown rice from plants in (A–D). Rice plants were grown in a Cd polluted paddy field until harvest, Values are mean ± sd, n = 5–6 in (A and B), 4–7 in (C and D), and 6 in (E and F). Significant differences were determined by ANOVA test (P < 0.05).

