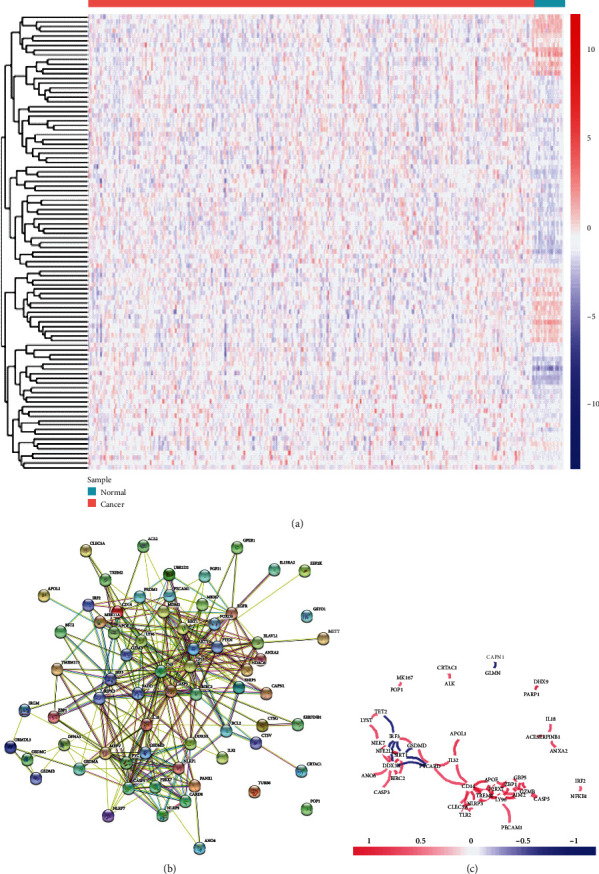
Figure 1.

Expression and interaction of the PRGs in EC. (a) Heatmap (blue: low expression level; red: high expression level) of the PRGs in EC (green) and normal endometrial tissues (red). (b) Interactions of the PRGs shown by the PPI network (score = 0.9). (c) Correlation network containing PRGs with core > 0.5 (red: positive correlations; blue: negative correlations).
