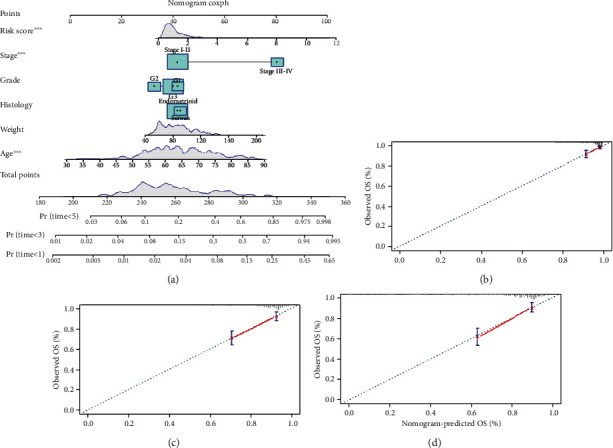
Figure 10.

Nomogram for predicting the 1-, 3-, and 5-year survival probability of patients with EC. (a) Age, weight, histology, grade, stage, and risk score fitted into the nomogram. Calibration curves of (b) 1 year, (c) 3 years, and (d) 5 years for the nomogram.
