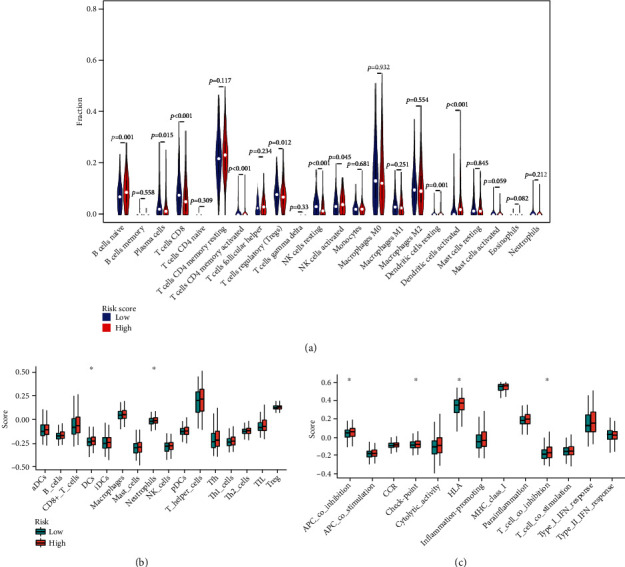
Figure 11.

TIICs of EC patients. (a) Violin plot showed the different proportions of TIICs in the high- and low-risk group. Comparison of the ssGSEA scores for immune cells (b) and immune pathways (c) between the high- and low-risk group (∗p < 0.05).
