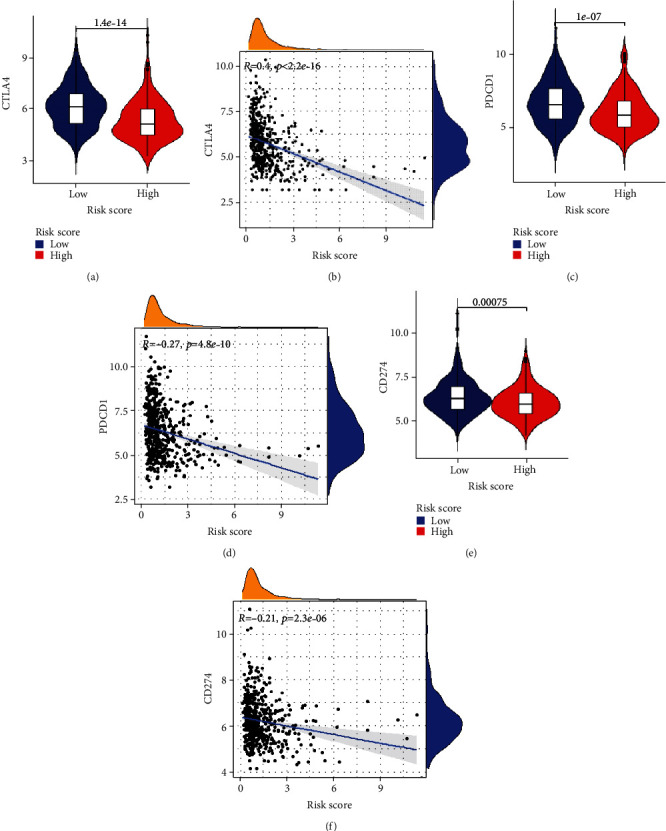
Figure 12.

The association between PRG signature and immune checkpoint genes. (a) Expression of CTLA4 in low and high risk. (b) Correlation between risk score and CTLA4. (c) Expression of PD1 in low and high risk. (b) Correlation between risk score and PD1. (e) Expression of PDL1 in low and high risk. (f) Correlation between risk score and PDL1.
