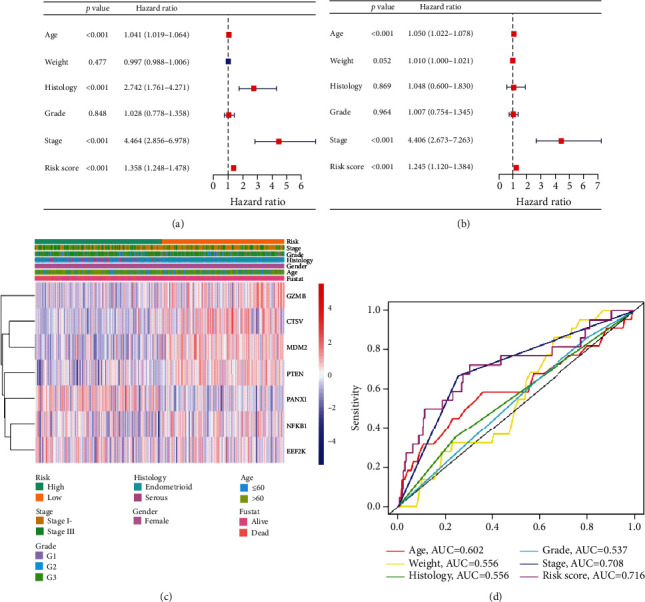
Figure 9.

Relationship between the risk scores and clinicopathological factors in EC. (a) Forest plot of univariate analysis for the entire TCGA cohort. (b) Forest plot of multivariate analysis for the entire TCGA cohort. (c) Heatmap showed the distribution of clinicopathological factors and seven PRGs between the high- and low-risk groups. (d) The AUC of the ROC curve showed the prognostic accuracy of age, weight, histology, grade, stage, and risk scores.
