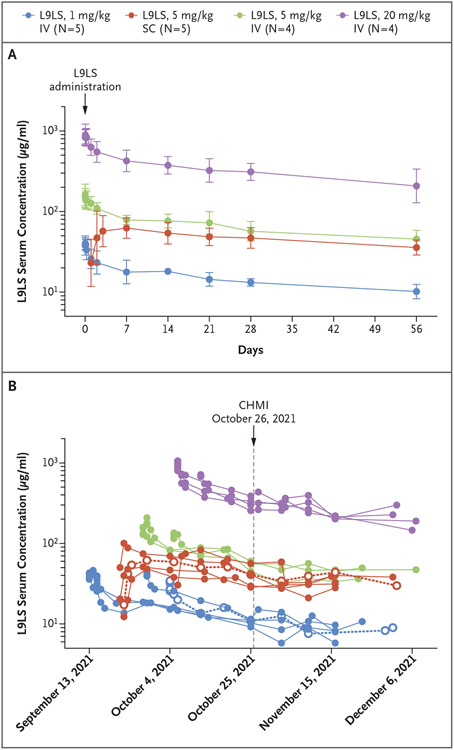
Figure 3. Serum Concentrations of L9LS.
Panel A shows the geometric mean serum concentrations of L9LS with 95% confidence intervals (indicated by I bars) for each dose group after administration of a single dose of L9LS. Panel B shows the serum concentrations of L9LS over time in individual trial participants who underwent CHMI. Individual horizontal dotted lines with open circles indicate malaria infection (in one participant who received 1 mg per kilogram intravenously and in one participant who received 5 mg per kilogram subcutaneously).

