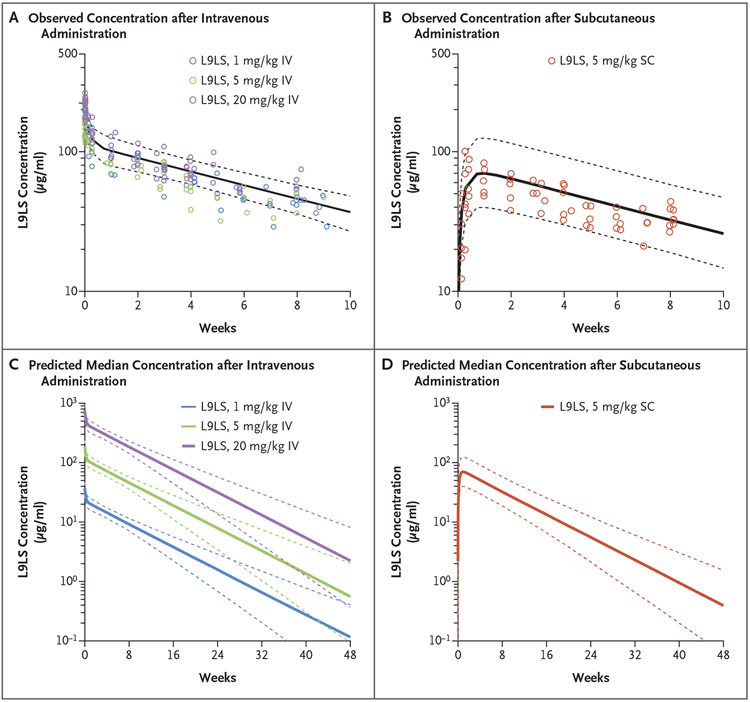
Figure 4. Predictions for Serum Concentrations after Intravenous or Subcutaneous Administration of L9LS.
Panels A and B show pharmacokinetic modeling for intravenous and subcutaneous administration of L9LS. Observed L9LS concentrations (normalized for each dose administered intravenously or subcutaneously) are overlayed for the comparison. The predicted median serum concentrations of L9LS (solid lines) and 90% prediction intervals (5th and 95th percentiles) (dashed lines) are shown. Panels C and D show the predicted median L9LS serum concentrations (solid lines) 48 weeks after administration of a single dose according to intravenous dose groups (1 mg per kilogram, 5 mg per kilogram, and 20 mg per kilogram) and the subcutaneous dose group (5 mg per kilogram) with 90% prediction intervals (5th and 95th percentiles) (dashed lines). Values were calculated on the basis of Monte Carlo simulations with the use of a population pharmacokinetic model.

