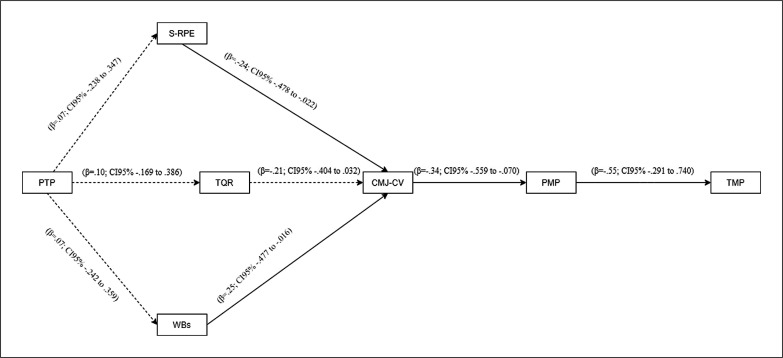
FIG. 1.
Performance explanatory model. Standardized direct effects of each path and sample Note: PTP = previous team performance; S-RPE = session rated perceived exertion; TQR = total quality recovery; WBs = well-being score; CMJ-cv = coefficient variation of countermovement jump; PMP = player match performance; TMP = team match performance.

