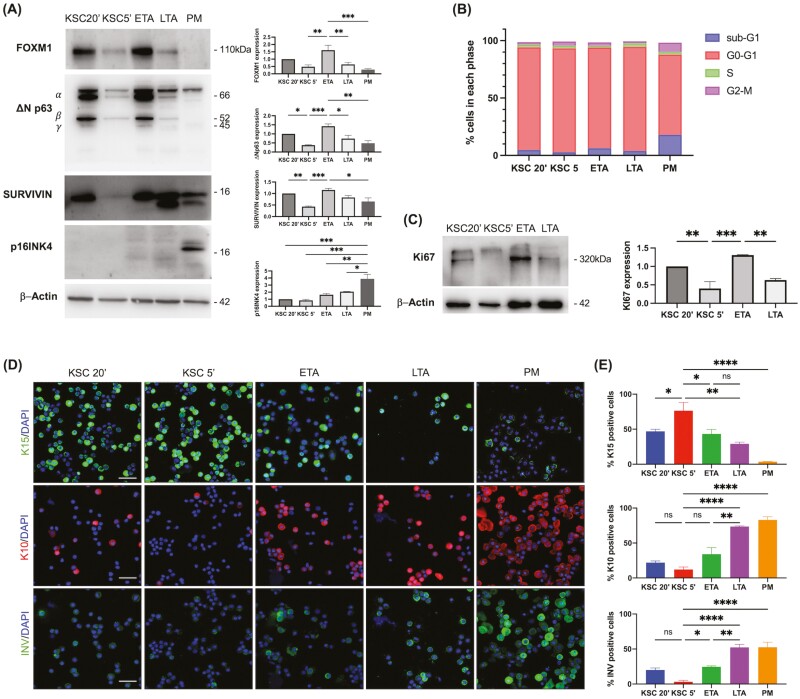
Figure 2.
Molecular characterization of keratinocyte subpopulations. (A) Keratinocytes were isolated based on their ability to adhere to type IV collagen. Subpopulations were obtained: KSC20ʹ, KSC5ʹ, ETA, LTA, and PM. Cells were lysed immediately after the subpopulation isolation and the expression of FOXM1, deltaNp63 (ΔNp63), Survivin, p16INK4 were analyzed by WB. Actin was used as an internal control. Representative pictures of at least 3 different population isolations are shown. Densitometric analysis per each protein was shown (mean ± SEM, n = 3), evaluated by Fiji-ImageJ software. (B) Freshly isolated KSC 20ʹ, KSC 5ʹ, ETA, LTA, and PM cells were stained with propidium iodide (PI) solution and analyzed by flow cytometry. (C) Freshly isolated KSC 20ʹ, KSC 5ʹ, ETA, and LTA were lysed and Ki67 was analyzed by WB. Representative pictures of at least 3 different population isolations are shown. Densitometric analysis is shown (mean ± SEM, n = 3). (D) Freshly isolated subpopulations were double stained with DAPI and anti-K15, -K10, -Involucrin antibodies, and analyzed by confocal microscopy. Bar = 100 μm. (E) The number of positive cells was evaluated in at least 3 different fields. Data are represented as mean ± SEM. Ordinary one-way ANOVA followed by Tukey’s multiple comparisons are represented. ns: P > .05; * .01 < P < .05; ** P < .01; *** P < .001; **** P < .001.

