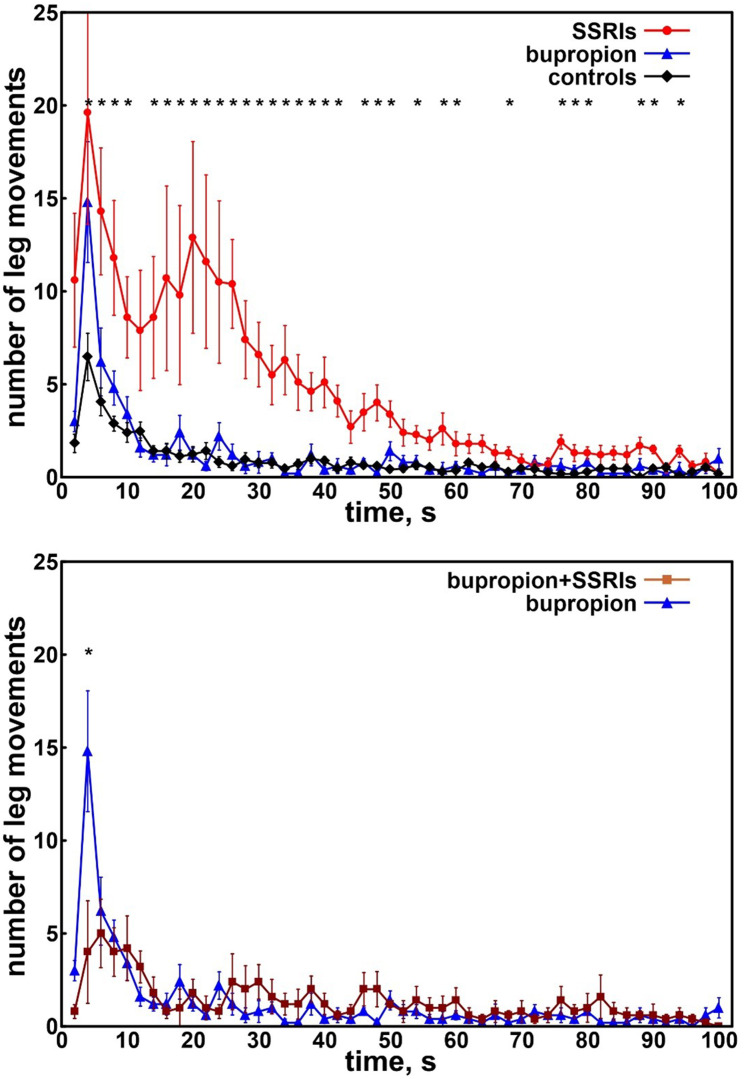
Figure 1. Distribution of intervals between consecutive LMS in adolescents.
Top panel: Distribution of intervals between consecutive LMS in adolescents taking SSRIs (red circles) or bupropion (blue triangles) and in control patients (black diamonds). Bottom panel: Distribution of intervals between consecutive LMS in adolescents taking bupropion alone (blue triangles) or bupropion plus SSRIs (brown squares). Data are shown as mean and standard errors (whiskers). Asterisks along the top indicate a significant difference (P < .015) obtained with the Kruskal–Wallis ANOVA comparing the 3 groups and computed for all points of the graphs. ANOVA = analysis of variance, LMS = leg movements during sleep, SSRIs = selective serotonin reuptake inhibitors.

