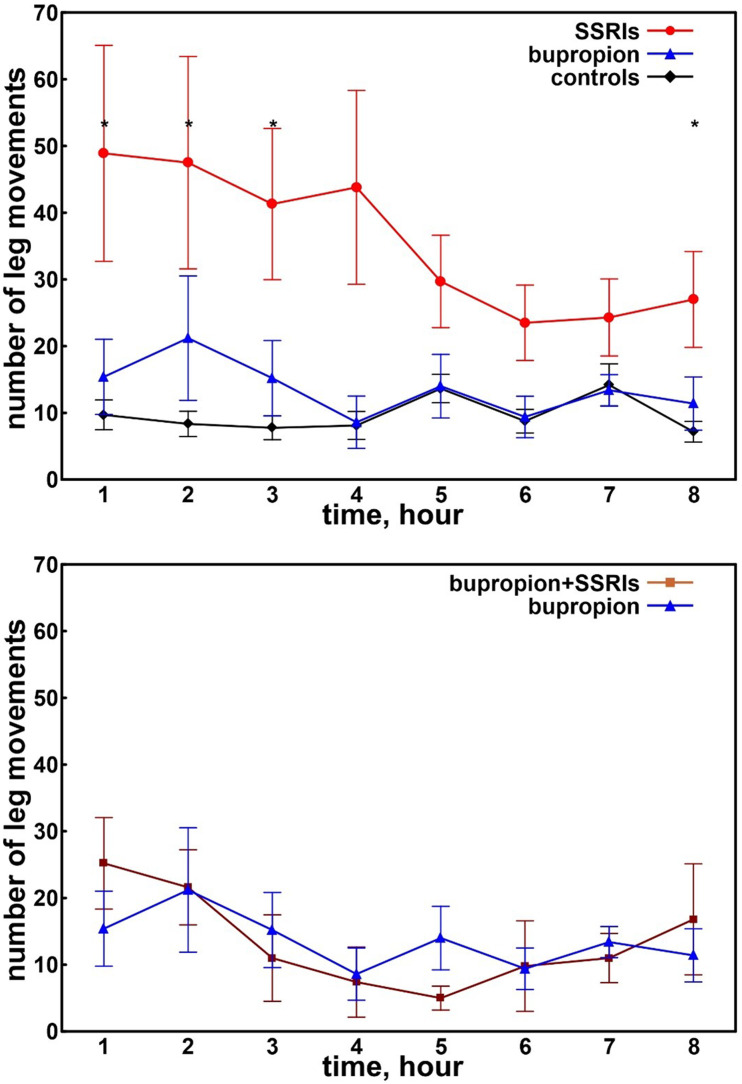
Figure 2. Number of leg movements recorded during the first 8 hours of sleep in adolescents.
Top panel: Number of leg movements recorded during the first 8 hours of sleep in adolescents taking SSRIs (red circles) or bupropion (blue triangles) and in control patients (black diamonds). Bottom panel: Number of leg movements recorded during the first 8 hours of sleep in adolescents taking bupropion alone (blue triangles) or bupropion plus SSRIs (brown squares). Data are shown as mean and standard errors (whiskers). Asterisks on the top indicate a significant difference (P < .015) obtained with the Kruskal–Wallis ANOVA comparing the 3 groups and computed for all points of the graphs. ANOVA = analysis of variance, SSRIs = selective serotonin reuptake inhibitors.

