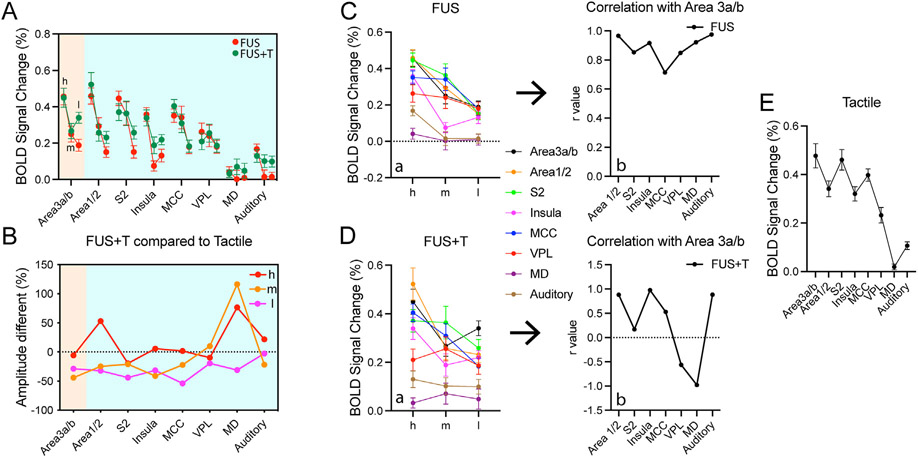
Fig. 5. Correlation of FUS dose – fMRI responses between target and off-target regions in resting and activation states.
(A) Plots of peak BOLD signal changes at the FUS-targeted area 3a/3b and seven off-target regions in response to FUS stimulation at three FUS intensities (h: high, m: medium, l: low) during FUS alone (red curves) and simultaneous FUS + Tactile (green curves) stimulation. (B) Plots of % BOLD signal differences between simultaneous FUS + tactile and tactile stimulation conditions (set as 100%) at each region. (C-D) Ca & Da: plots of BOLD signal changes at three FUS intensities across all regions at rest (Ca, FUS-alone condition) and activation (Da, FUS + tactile condition) states. Cb & Db: plots of correlation (r values) between area 3a/3b and each of the off-target regions. E: plots of % BOLD signal changes across all regions in response to tactile stimulation at left hand digits.

