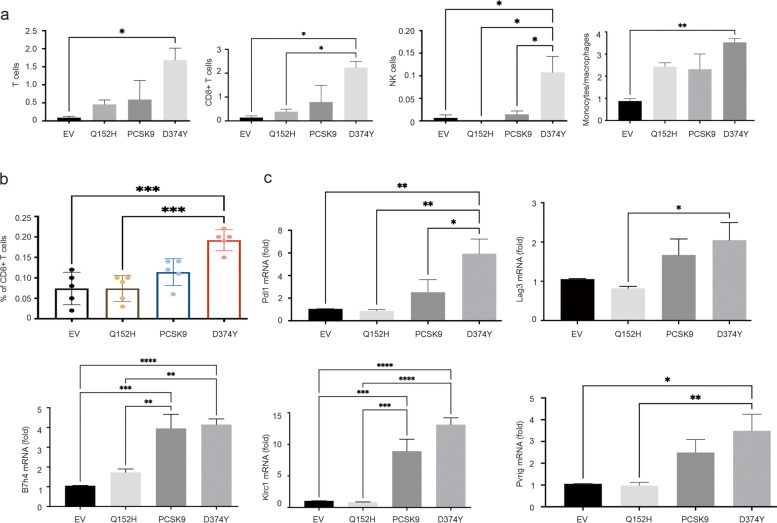
Fig. 5.
Immune cell infiltration and expression of immune checkpoints in B16 allografts. (a) Lymphocyte infiltration in B16EV, PCSK9, D374Y, and Q152H tumors were determined using RNA-seq expression data with mMCP computation program [52]. Means ± SDs are graphed. *: p < 0.05 and **: p < 0.01 in the indicated comparisons. (b) CD8 + T cell contents in B16EV, PCSK9, D374Y, and Q152H tumors were determined by immunofluorescence staining. Five tumors per tumor type were stained and quantified. Typical images were presented in Additional file 4: Fig S4. (c) The indicated immune checkpoints were amplified by real-time PCR in allografts generated by the indicated B16 cells. *: p < 0.05, **: p < 0.01, ***: p < 0.001, ****: p < 0.0001

