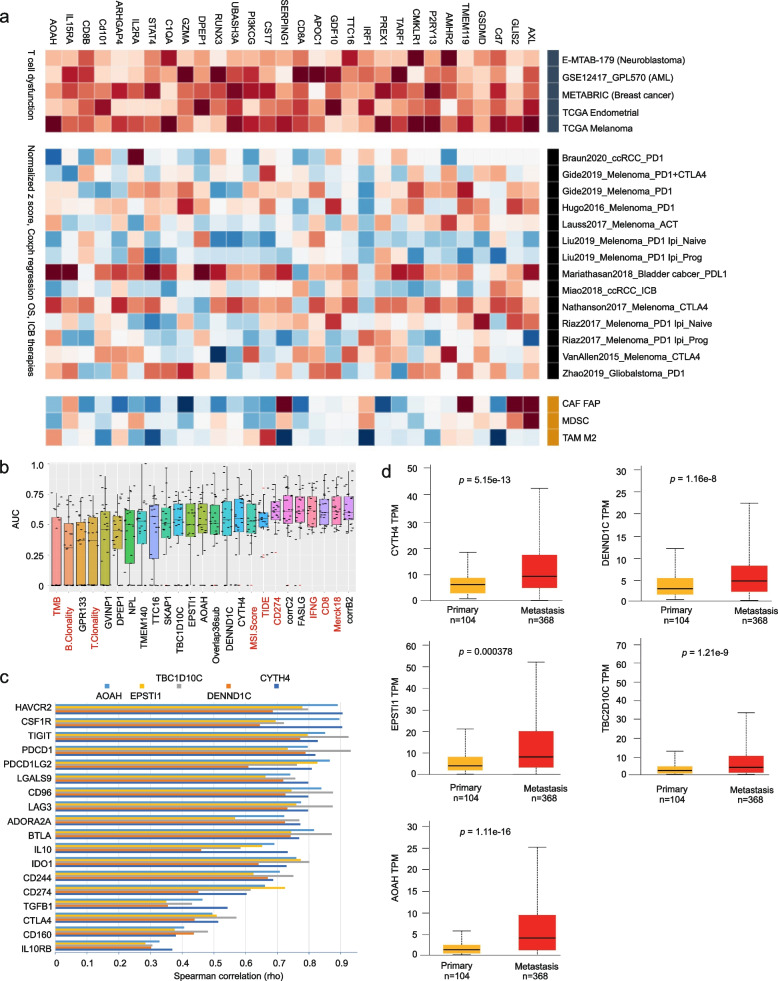
Fig. 8.
Identification and characterization of novel and effective biomarkers in assessing response to ICB. (a) The 30 top-ranked genes among 143 DEGs selected for their association with T cell dysfunction (Additional file 27: Table S8). CAF FAP: cancer-associated fibroblasts fibroblast activation protein; MDSC: myeloid-derived suppressor cells; TAM M2: M2 tumor-associated macrophages. (b) Evaluation of the indicated genes and multigene panels produced in this study along with published genes and signatures (red) for their biomarker value by AUC in discriminating resistance to ICB in 25 cancer populations treated with ICB. The evaluation was performed using the TIDE platform. (c) Spearman correlations between AOAH, EPSTI1, TBC1D10C, DENND1C, or CYTH4 and the indicated immune checkpoints (Y axis) in SKCM were determined using TISIDB [55]. (d) Analysis of the indicated gene expression in primary and metastatic melanoma using TCGA SKMC organized by UALCAN [58]

