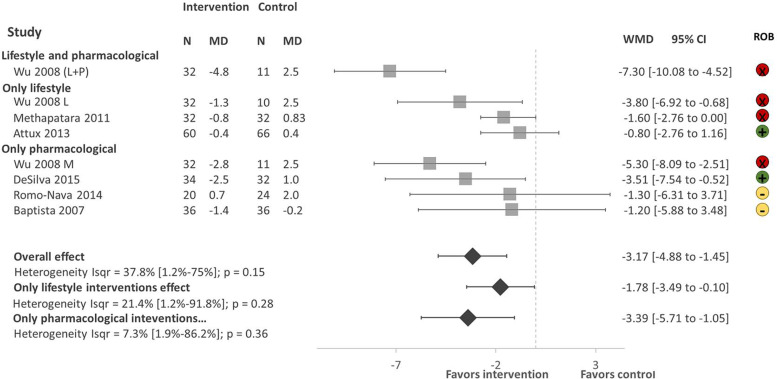
Fig. 3.
Forest plot of effect of lifestyle and pharmacological interventions on weight reduction in people with SMI. Effects on estimated weight reduction for each study depicted as solid squares; error bars indicate 95% CIs. The pooled estimates for overall effect, only lifestyle and only pharmacological interventions are shown as the diamonds. MD, mean difference between baseline and endpoint; WMD, weight mean difference between intervention and control; CI, confidence interval; ROB; Risk of bias; green, low, yellow, some concerns, red, high.

