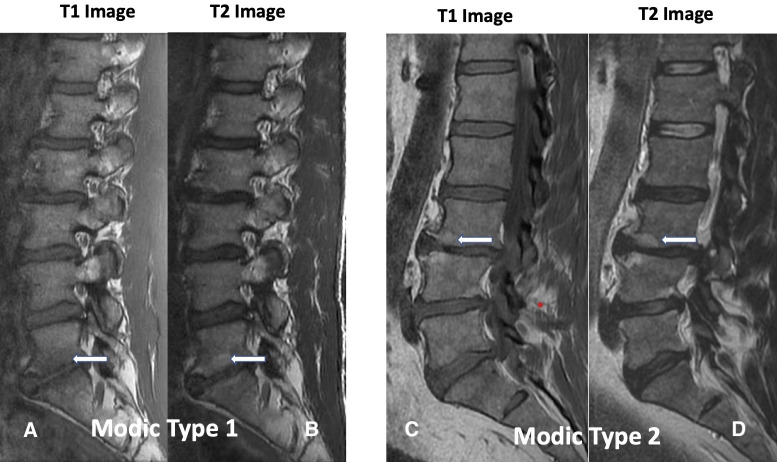
Figure 1.
Modic change 1 (MC1) and Modic change 2 (MC2). Images A and B demonstrate decreased signal intensity of T1-weighted images and increased signal intensity on T2-weighted images, respectively (white arrows), corresponding to MC1 at the L5-S1 disc space. Images C and D correspond to L3-L4 MC2 characterized by increased endplate signal intensity on T1-weighted images and on T2-weighted images, respectively (white arrows). There are similar changes at the L4-L5 disc space (no arrows).

