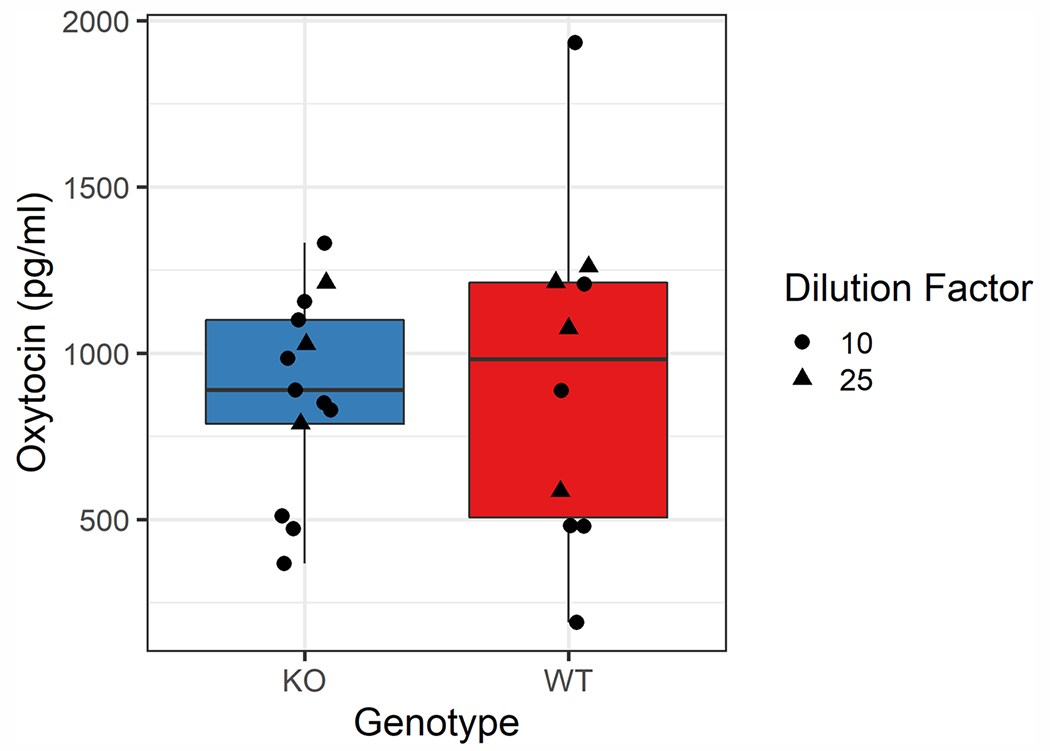
Fig. 1.

Boxplot comparing the dilution-corrected measured oxytocin concentrations in unextracted urine samples across genotypes on the Arbor Assays kit. Depending on available sample volume, samples were assayed at a 1:10 (circle) or 1:25 (triangle) dilution into assay buffer. The mean measured oxytocin concentrations were not significantly different across genotypes (Mean ± SD: WT = 930.8 ± 512.7 pg/ml, KO = 885.7 ± 295.6 pg/ml; Welch’s t(13.5) = 0.248, p = 0.808). Note that this pattern was true even with the presence of a single high WT sample; excluding this point, Mean WT = 819.6 ± 395.5, which is below the KO mean. The limits of detection are 229 pg/ml for samples assayed at a 1:10 dilution and 573 pg/ml for those assayed at a 1:25 dilution.
