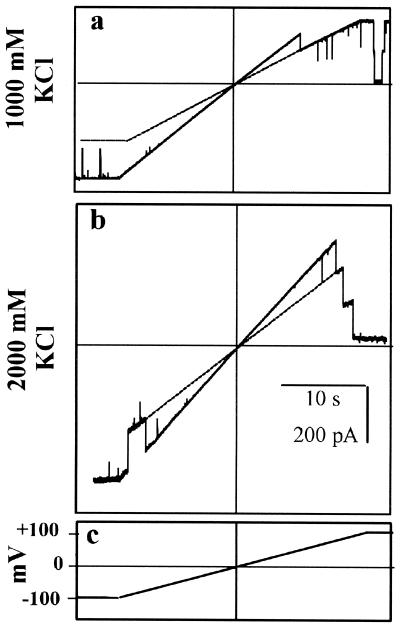
FIG. 4.
Measurement of channel conductances using voltage ramps. C. trachomatis MOMP channels (in the same experiment) were exposed to 1 M KCl (a) or 2 M KCl (b), present in each case on both sides of the incorporated proteins. The membrane potential was varied between −100 mV and +100 mV at a constant rate of 6.25 mV/s, using the voltage clamp protocol summarized in panel c. Each main panel shows three unit conductances, and the dotted lines project the “closed” levels of the top (third) conductance state. Note that all the real and projected lines are linear and intersect at the point of zero current and zero potential (the current and voltage axes are indicated by fine horizontal and vertical lines, respectively). The gradients of the channel traces (pA/V) correspond to the appropriate multiple (1, 2, or 3) of the channel slope conductance (pS).

