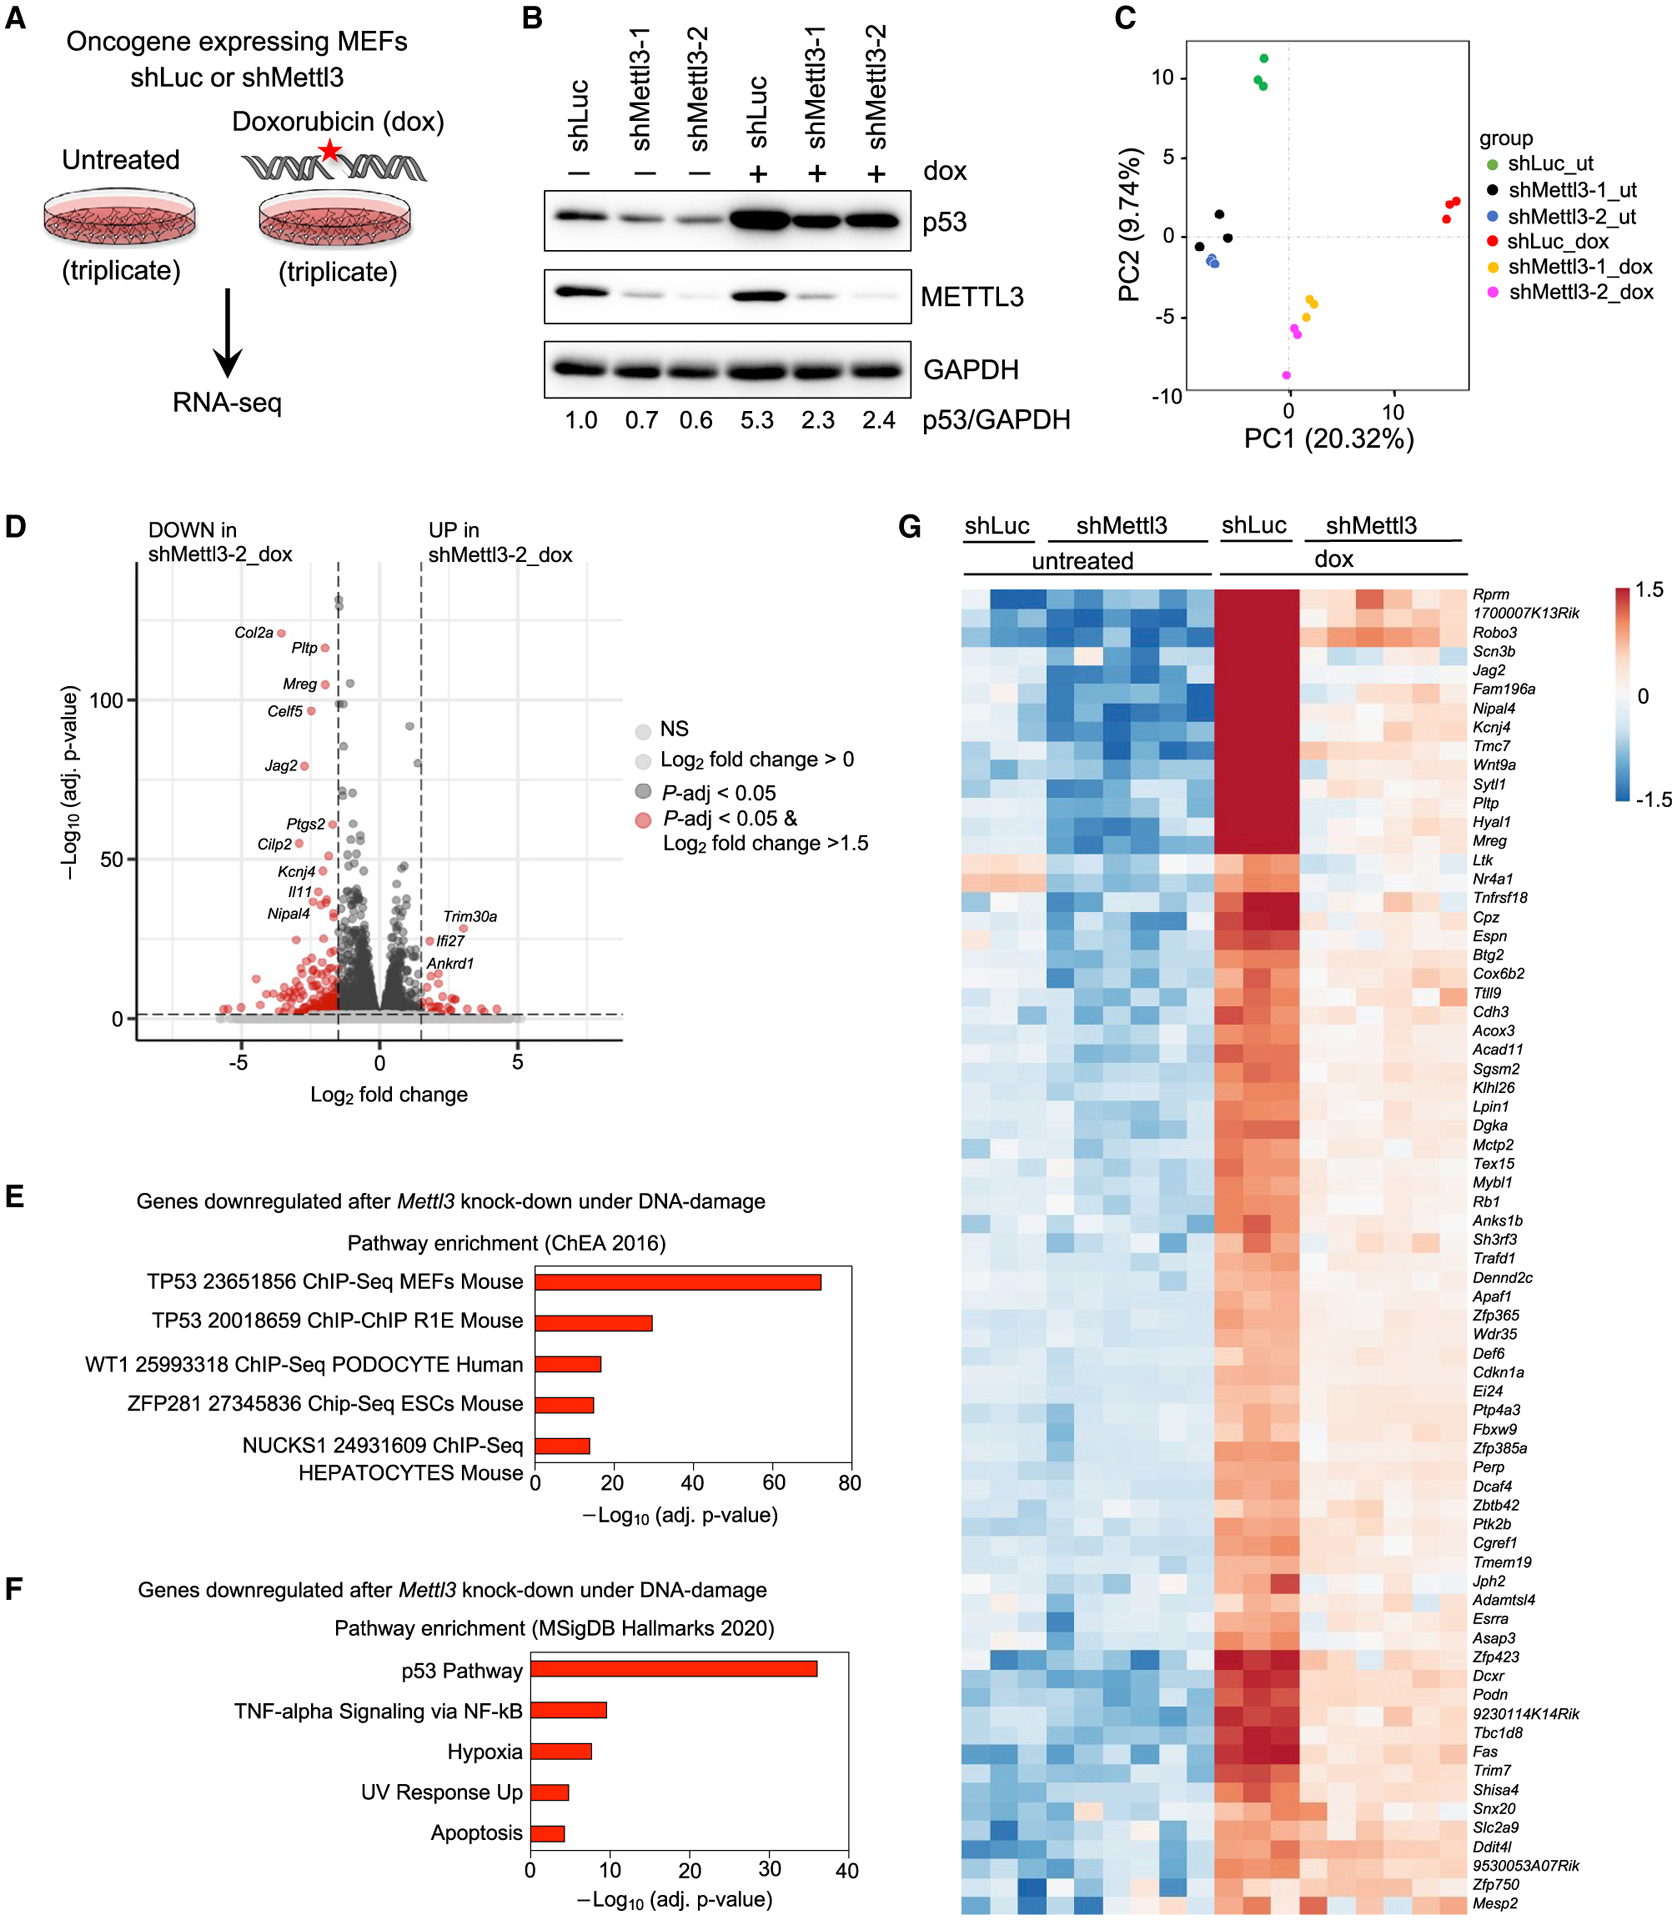
Figure 2. METTL3 promotes p53 transcriptional programs in response to DNA damage.

(A) E1A;HRasG12V-expressing WT MEFs transduced with shLuc or shMettl3 hairpins were either left untreated or treated with 0.2 μg/mL dox for 6 h followed by RNA-seq analysis.
(B) Immunoblots showing p53 and METTL3 protein levels in shLuc and shMettl3 shRNA-expressing cell lines. GAPDH serves as a loading control. Representative immunoblots are shown from three biological replicates, and two different MEF lines per genotype were used for this experiment.
(C) Principal component analysis of gene expression profiles of untreated and dox-treated shLuc and shMettl3 shRNA-expressing E1A;HRasG12V MEFs.
(D) Volcano plot showing differentially expressed genes after Mettl3 knockdown under DNA damage conditions. The horizontal dashed line represents the threshold of the adjusted p value of 0.05, while the vertical line represents the threshold of the log2 fold change of greater than 1.5.
(E and F) Functional annotation of genes downregulated in dox-treated shMettl3-2 MEFs relative to dox-treated shLuc MEFs, as identified by Enrichr analysis of ChEA 2016 (E) and MSigDB Hallmarks 2020 (F) data sets.
(G) Heat map showing expression patterns of p53-bound and -regulated target genes in RNA-seq analysis of untreated or dox-treated shLuc and shMettl3 E1A;HRasG12V MEFs.
