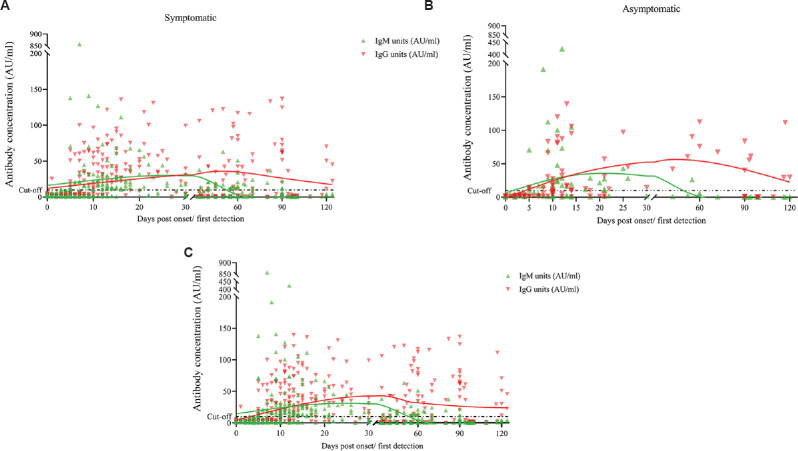
Fig. 1.
Kinetics of IgM and IgG antibodies in COVID-19 patients. Scatter plot for SARS-CoV-2. IgM (green) and IgG (red) antibodies units plotted against time with trend lines obtained from the cumulative values from 0 to 120 days POD. (A) Distribution of IgM and IgG antibody positivity in 373 serum collected from 173 symptomatic patients; and (B) ninety serum collected from 45 asymptomatic patients. (C) Profile of IgM and IgG antibody positivity in all 463 samples collected from 218 patients. The assay cut-off (dotted line) was10 AU/ml for both IgM and IgG detection kits. POD, post-onset of disease.

