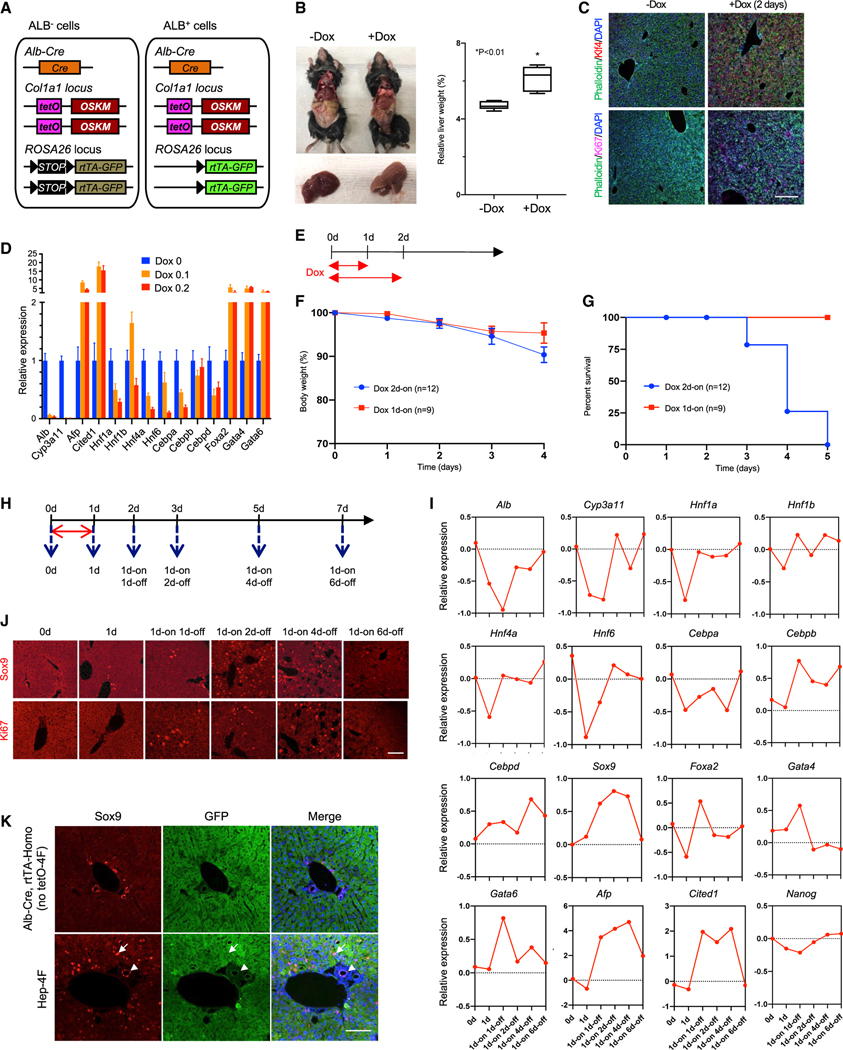
Figure 1. Induction of transient, partial reprogramming by liver-specific 4F expression.
(A) Schematic representation of the genetic makeup for lineage-traceable, liver-specific 4F inducible mouse models. In this model, rtTA can be activated by Alb-Cre, allowing for specific 4F induction in the liver in a Tet-ON manner.
(B) Livers collected from Dox-treated and untreated Hep-4F mice 2 days after Dox administration. Left: representative images are shown. Right: relative liver weight (% body weight) is shown. Data represent the mean with SE (n = 5). *p < 0.01 (unpaired t test).
(C) Immunostaining for Klf4 and Ki67. Livers were collected 2 days after Dox administration. Scale bar, 200 μm.
(D) qPCR analysis for liver-related genes in the liver of Hep-4F mice treated with different concentrations of Dox (0.1 or 0.2 mg/mL) for 2 days. Data represent the mean with SD (n = 3; technical replicates).
(E) Schematic representation for Dox treatment protocol.
(F and G) Body weight (F) and survival (G) of Hep-4F mice after Dox treatment (0.1 mg/mL; 1d-on, n = 9; 2d-on, n = 12).
(H) Schematic representation of time course for Dox treatment protocol.
(I and J) Time course experiment of qPCR (I) and IHC for Sox9 and Ki67 (J). Data represent the mean (n = 2; biological replicates). Scale bar, 200 μm.
(K) GFP-based lineage-tracing experiments for hepatocytes after 4F induction. Livers were collected 1 day after Dox withdrawal. White arrow and white arrowhead indicate atypical Sox9+ cells and Sox9+ cholangiocytes, respectively. Scale bar, 100 μm.

