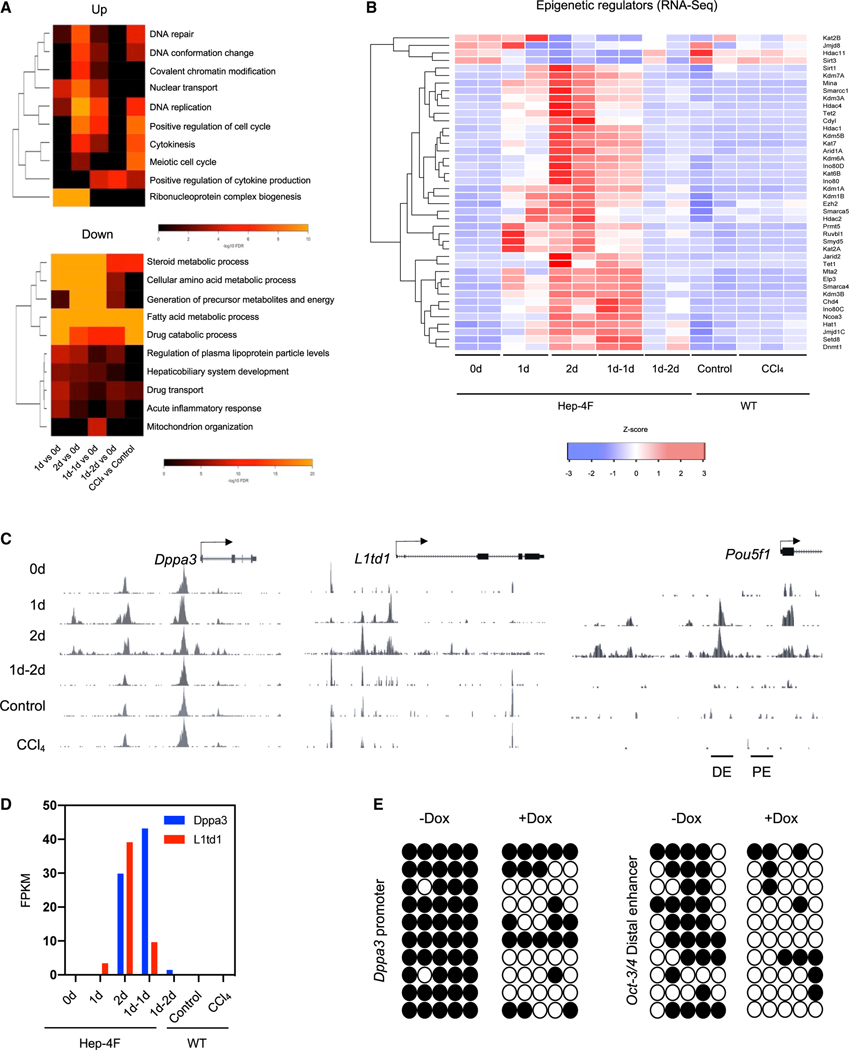
Figure 3. Epigenetic reprogramming by liver-specific 4F expression.
(A) GO analysis for differentiation-expressed genes in RNA-seq.
(B) Heatmap for epigenetic modifiers in Hep-4F mice.
(C) Genome browser view of the ATAC-seq data at the indicated gene loci.
(D) Expression levels of Dppa3 and L1td1 genes in Dox-treated Hep-4F mice. Data were extracted from RNA-seq (Figure 2). Data represent the mean (n = 2; biological replicates). FPKM, fragments per kilobase of exon per million mapped fragments.
(E) Bisulfite sequencing of the Dppa3 promoter and distal enhancer of Oct-3/4 with the liver samples collected from the mice treated with or without Dox for 2 days.

