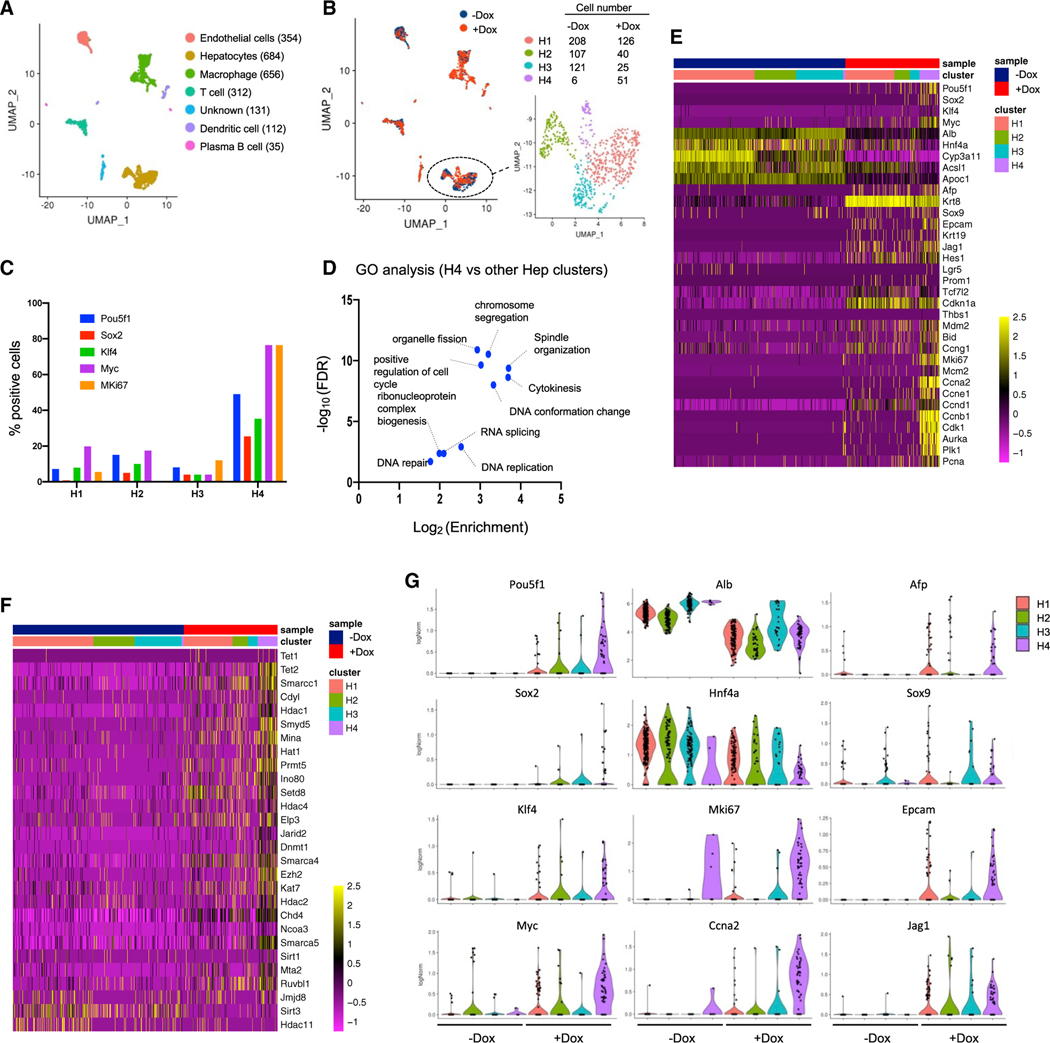
Figure 4. Single-cell transcriptome analysis of Hep-4F mice.
(A) UMAP visualization of liver cell clusters. Hep-4F mice were treated with or without Dox for 1 day and single-cell suspensions were prepared from the liversisolated at 1 day after Dox withdrawal. Each cell type was characterized based on gene expression (Figure S5A).
(B) Left: UMAP plot of untreated (−Dox) or Dox-treated (+Dox) liver cell clusters: −Dox (blue dots) and +Dox (red dots). Right: enlarged hepatocyte clusters are shown.
(C) Relative cell number for the indicated genes in each hepatocyte cluster.
(D) Volcano plots of GO analyses for DEGs between H4 cells and the other hepatocyte cells.
(E and F) Heatmap of gene expression of the liver-related and cell-cycle-related genes (E) and of the epigenetic modifiers (F) in the cells of hepatocyte subclusters.
(G) Violin plots for gene expression of the reprogramming-related genes in each hepatic cluster.

