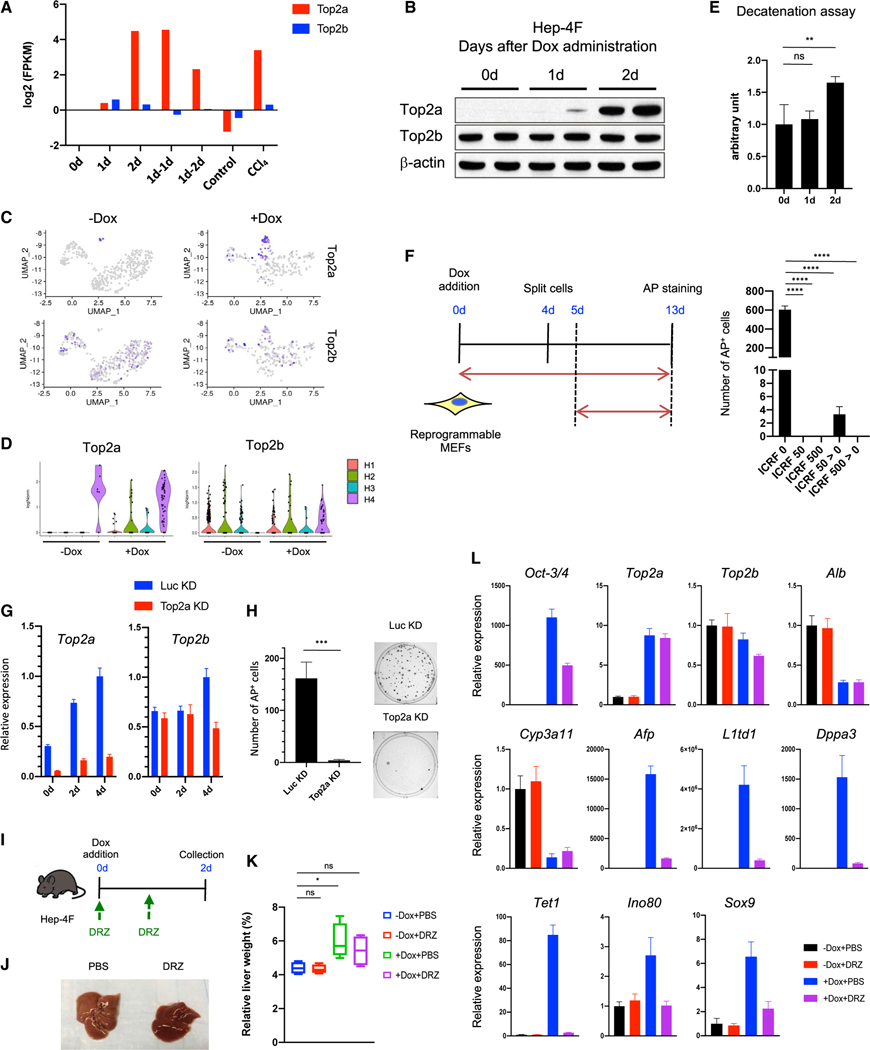
Figure 5. Role of Top2a on reprogramming in vitro and in vivo.
(A) Time course for gene expression of Top2a and Top2b in reprogramming livers. Data were extracted from RNA-seq (Figure 2). Data represent the mean (n = 2; biological replicates).
(B) Western blotting for Top2a and Top2b in liver samples collected at indicated time points after Dox administration.
(C) UMAP visualization for Top2a and Top2b.
(D) Violin plots for gene expression of Top2a and Top2b in each hepatic cluster.
(E) Decatenation assay for topoisomerase activity in liver samples. Data represent the mean with SD (n = 4). ns, not significant.
(F) Effect of ICRF-193 (Top2 inhibitor) on iPSC reprogramming. Left: schematic representation for ICRF-193 (ICRF) treatment protocol is shown. Right: reprogramming efficiency is shown. Data represent the mean with SD (n = 3).
(G) qPCR for Top2a and Top2b in the cells expressing short hairpin RNA (shRNA) for Top2a (Top2a knockdown [KD]) or for Luciferase (Luc KD). Data represent the mean with SD (n = 3; technical replicates).
(H) Reprogramming efficiency of Top2a or Luc KD cells. Data represent the mean with SD (n = 3).
(I) Schematic representation of dexrazoxane (DRZ) treatment protocol.
(J) Livers collected from PBS-treated and DRZ-treated Hep-4F mice 1 day after Dox withdrawal.
(K) Relative liver weight (% body weight). Data represent the mean with SE (n = 5).
(L) qPCR analysis for PBS- or DRZ-treated Hep-4F mice with or without Dox for 2 days. Data represent the mean with SD (n = 3; technical replicates).
Statistical analyses were conducted by unpaired t test or one-way ANOVA with Tukey’s post hoc analysis. *p < 0.05; **p < 0.01; ***p < 0.001; ****p < 0.0001.

