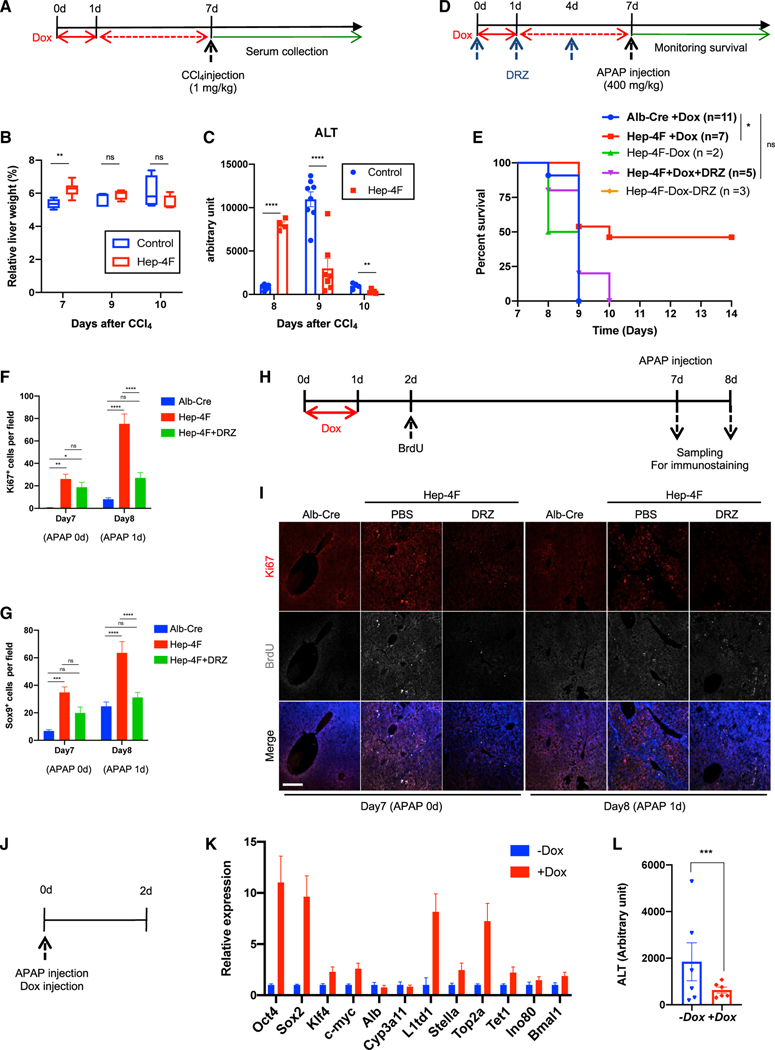
Figure 6. Improvement of liver regeneration capacity induced by 4F-mediated partial reprogramming.
(A) Schematic representation for CCl4 treatment protocol. Alb-Cre mice (no 4F cassette) or Hep-4F mice were treated with Dox for 1 day. Six days following Dox withdrawal, the mice were injected with CCl4.
(B) Relative liver weight (% body weight). Data represent the mean with SE (n = 5).
(C) ALT levels of Alb-Cre or Hep-4F mice. Data represent the mean with SE (control: n = 5 [8 days], n = 8 [9 days], n = 4 [10 days]; Hep-4F, n = 4 [8 days], n = 7 [9 days], n = 5 [10 days]).
(D) Schematic representation for APAP treatment protocol. Hep-4F mice were treated with or without Dox for 1 day. Six days following Dox withdrawal, the mice were injected with APAP.
(E) Survival curve of Hep-4F mice.
(F) Quantification of Ki67+ cells. Data represent the mean with SE (n = 12).
(G) Quantification of Sox9+ cells. Data represent the mean with SE (n = 12).
(H) Schematic representation for APAP treatment protocol for cell tracking of BrdU-positive cells.
(I) IHC for Ki67 and BrdU. Scale bar, 200 μm.
(J) Schematic representation for the protocol of simultaneous injection of Dox and APAP.
(K) qPCR analysis for Hep-4F mice with or without Dox for 2 days. Data represent the mean with SD (n = 3; technical replicates).
(L) ALT levels of Dox-treated or untreated Hep-4F mice 2 days after APAP treatment. Data represent the mean with SE (n = 6).
Statistical analyses were conducted by unpaired t test or one-way ANOVA with Tukey’s post hoc analysis.*p < 0.05; **p < 0.01; ***p < 0.001; ****p < 0.0001.

