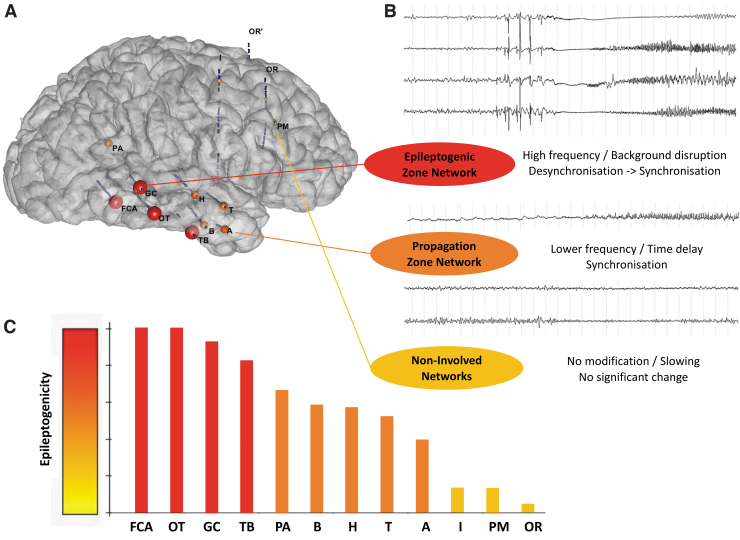
FIG. 1.
Represents a seizure recorded in SEEG where we observe a simultaneous coimplication of several distinct/distant cerebral areas at the time of the initiation and the propagation of the seizure. The frequent observation of this simultaneous involvement of a “network” of brain areas during seizures, as well as the connectivity changes observed at the time of the seizures (not shown here), led us to propose the concept of the three “networks”: EZN, PZN, and NIN. (A) A 3D representation of the epileptogenicity of the sampled area in a patient with SEEG recordings. EZN are the nodes with a big red sphere, PZN are the nodes with a medium orange sphere, and NIN are the nodes with a small yellow sphere. (B) Example of SEEG traces during a seizure within the EZN, PZN, and NIN; and summary of the most frequent observed changes within each zone in terms of signal properties. (C) Bar plot of the level of epileptogenicity for the nodes sampled in this example, showing a gradual decrease of epileptogenicity (A, right middle temporal gyrus anterior part; B, right middle temporal gyrus anterior part; FCA, right middle temporal gyrus posterior part; GC, right superior temporal gyrus posterior part; H, right planum temporale; I, right middle frontal gyrus posterior part; OR, right superior frontal gyrus posterior part; OT, right middle temporal gyrus posterior part; PA, right angular gyrus; PM, right middle frontal gyrus anterior part; SEEG, stereo-EEG; T, right planum polare; TB, right inferior temporal gyrus anterior part). 3D, three dimensional; EZN, epileptogenic zone network; NIN, noninvolved zone network; PZN, propagation zone network.

