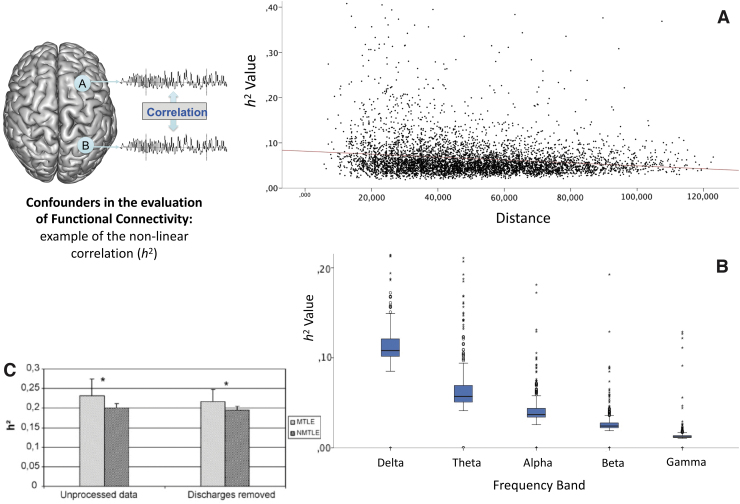
FIG. 2.
Illustrates the confounders influencing the estimation of functional connectivity through the example of the nonlinear correlation coefficient (h2). (A) The connectivity value decreases with the increase of intercontact distance (possible solutions: normalization by the distance (using noninvolved zone data)/multivariate analysis using the distance-effect). (B) The connectivity values are lower for higher frequencies (possible solution: sub-band analysis/comparison of the frequency content before analysis). (C) The IEDs (unprocessed data) increase slightly the connectivity value without changing the global trend of difference between zones (higher connectivity when mesiotemporal structures are epileptogenic MTLE vs. nonepileptogenic NMTLE). *Statistically significant. IEDs, interictal epileptiform discharges; MTLE, mesio-temporal lobe epilepsy; NMTLE, non mesio-temporal lobe epilepsy.

