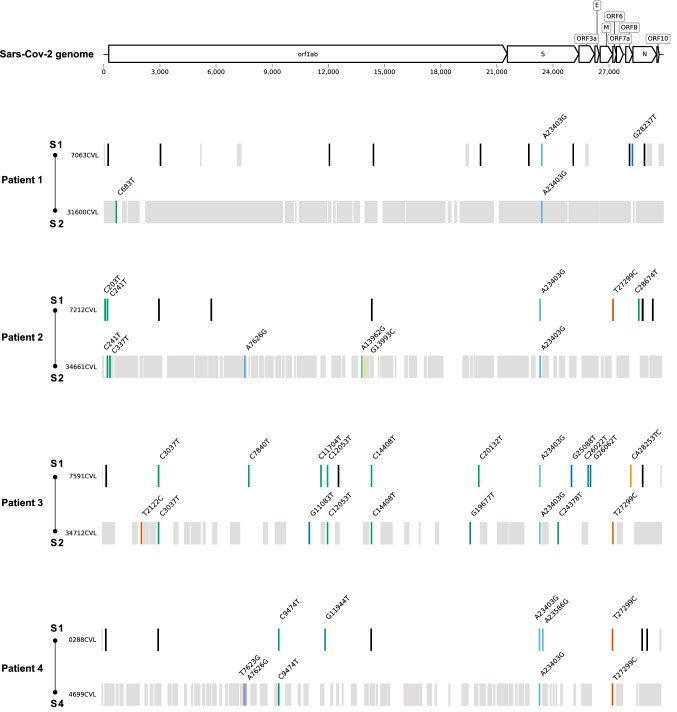
Fig. 2.
Mutation profile of the genome sequences of each patient's samples. Nucleotide substitutions are represented by colored bars. Black bars indicate regions not covered in both genome sequences, while grey bars indicate positions not included in the consensus sequence due to low coverage depth.

