
FIGURE 3.
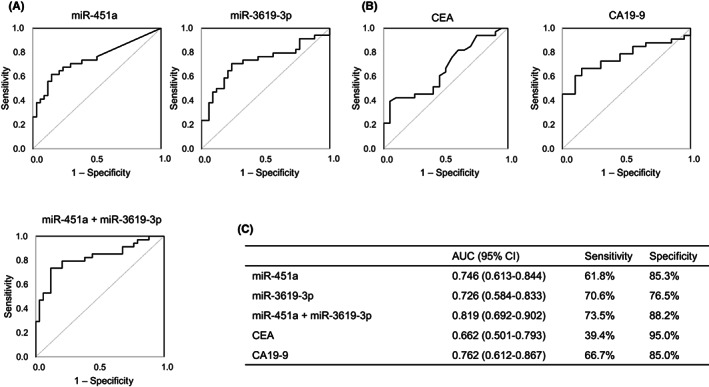
Receiver operating characteristic (ROC) curves in the validation set of patients with biliary tract cancer (BTC) and controls (CTRL). (A) Ability of each microRNA (miR‐451a and miR‐3619‐3p) and their combination to distinguish between BTC and CTRL samples in the validation set. (B) Ability of tumor markers (carcinoembryonic antigen [CEA] and carbohydrate antigen 19‐9 [CA19‐9]) to distinguish between BTC and CTRL samples in the validation set. (C) ROC analysis was used to determine the area under the ROC curve (AUC). CI, confidence interval.