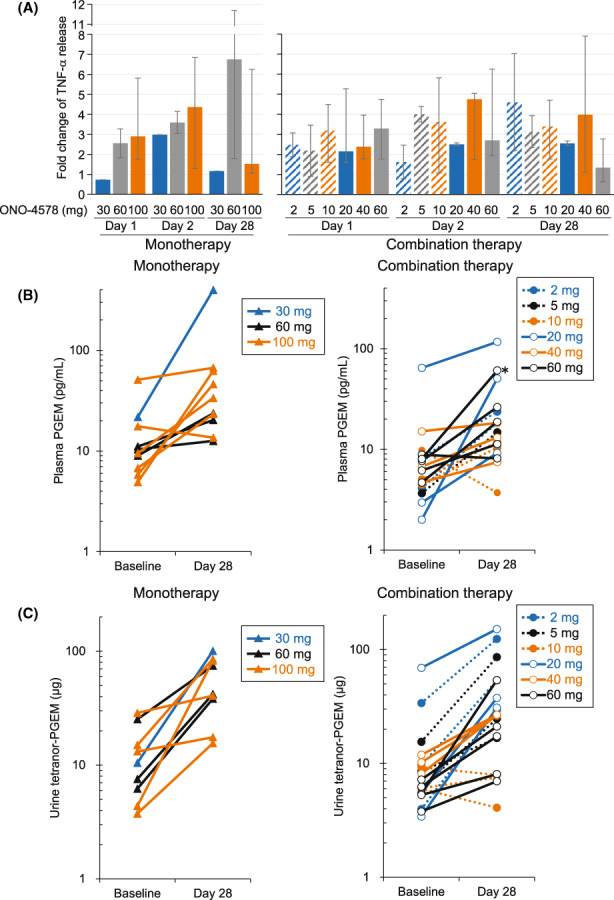
FIGURE 3.

Pharmacodynamic parameters in patients with solid tumors treated with ONO‐4578 monotherapy or in combination with nivolumab. (A) Tumor necrosis factor‐α (TNF‐α) release in whole blood samples collected on days 1, 2, and 28 were divided by baseline. Change in the median fold is shown. Error bars represent minimum and maximum values. (B, C) Plasma prostaglandin E2 metabolites (PGEM) (B) and tetranor‐PGEM in urine (C) of individual patients are shown. Data were missing in some patients due to discontinuation of study treatment before the completion of the 28‐day cycle or technical difficulties in the analysis
