FIGURE 1.

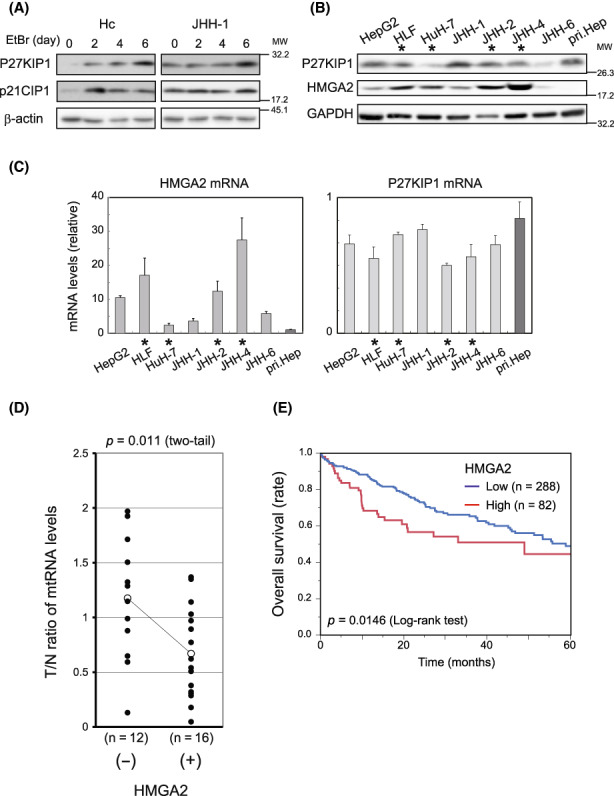
P27KIP1, p21CIP1 And HMGA2 expression in mitochondria‐deficient hepatocytes. (A) Immortalized hepatocytes (Hc) and JHH‐1 cells were cultured in the presence of 250 ng/ml ethidium bromide (EtBr) and 50 μg/ml uridine and western blotting was performed. β‐Actin, loading control. (B, C) Western blotting (B) and qPCR (C) were performed in hepatocellular carcinoma (HCC) cell lines and pri.Hep. Cell lines with asterisks (*), mt‐Low types. GAPDH, the loading control (B). In (C), the values normalized to the corresponding values of GAPDH are shown relative to that of pri.Hep. The values are mean ± SD from triplicates. (D) mtRNA levels were determined (Section 2) in pairs of HCC tumor (T) and adjacent nontumorous (N) tissues obtained from patients (Table S1). The ratio of the value in T relative to that in N in each pair was plotted in the group with amplification of HMGA2 positive (+) and negative (−). The statistically significance was assessed using an unpaired t‐test. (E) A Kaplan–Meier plot, showing patients categorized by HMGA2 expression levels (High [z‐score > 0], and Low [z‐score < 0]), was generated using the liver hepatocellular carcinoma dataset (TCGA, Firehose Legacy) in the cBioPortal (Section 2).
