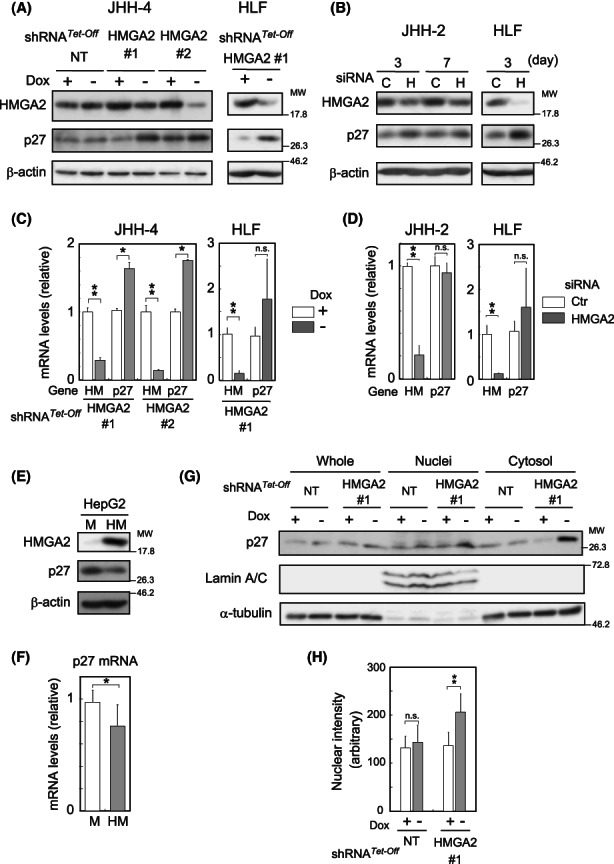
FIGURE 3.

Upregulation and downregulation of p27 levels in HMGA2‐silenced/expressing cells. (A–D) In (A) and (C) Dox‐responsive shRNA (HMGA2 #1 and #2)‐expressing cells were incubated with (+) or without (−) Dox for 4 (A) or 3 days (C). NT, nontarget shRNA. In (B) and (D) cells were treated with siRNA for the indicated days (B) or 3 days (D). C or Ctr, control; H, HMGA2 pooled siRNA. Western blotting (A, B) and qPCR (C, D) were performed. β‐Actin, the loading control. In (C) and (D), the values are shown relative to the control (Dox + or Ctr) after normalization to the corresponding values to TATA‐box binding protein. Gene: Hm; HMGA2, p27; P27KIP1. The values are mean ± SD from triplicates. (E, F) Western blotting (E) and qPCR (F) were performed in HMGA2 (HM)‐expressing or control (M) cells as described above. (G) JHH‐4 cells expressing HMGA2#1 shRNA and the control as in (A) were lysed, fractionated into cytosol and nuclei, and analyzed by western blotting with the indicated antibodies. α‐Tubulin and lamin A/C, the loading controls for whole and cytosol, and nuclei fractions. (H) JHH‐4 cells as in (A) were examined by immunocytochemistry using a p27 antibody (Figure S4A). The nuclear staining intensities measured using the FV10‐ASW Viewer software (Ver.4.2b) are presented as the mean ± SD (n = 19–21). **p < 0.005; *p < 0.05; n.s., not significant.
