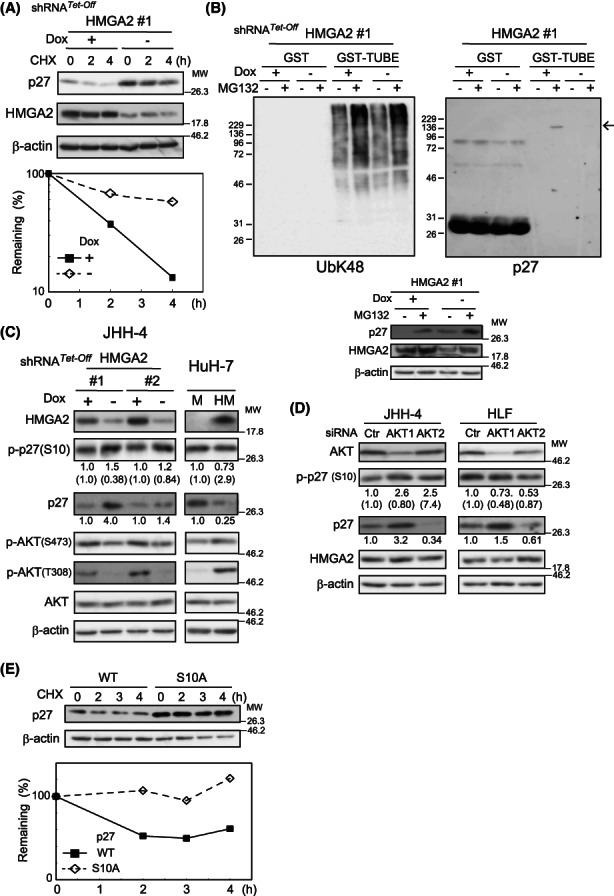
FIGURE 5.

AKT activity‐mediated HMGA2 regulation of p27 protein turnover. (A) Dox‐responsive HMGA2 #1 shRNA‐expressing HLF cells incubated for 4 days under Dox (+) or (−) were treated with CHX (100 μg/ml), and the p27 amount was quantified by western blotting using ImageJ software. After normalization to β‐actin values, the remaining p27 amounts were plotted. (B) Dox‐responsive HMGA2#1 shRNA‐expressing JHH‐4 cells incubated under Dox (+) or (−) conditions for 4 days were treated with (+) or without (−) 10 μM MG132 for 6.5 h and lysed. The lysates were pulled down with GST or GST‐TUBE (Section 2) and analyzed with the antibodies against p27 and polyubiquitin K‐48‐linkage (UbK48). An arrow indicates ubiquitinated p27 proteins. Aliquots of the lysates were analyzed by western blotting with the indicated antibodies (bottom). β‐Actin, the loading control. (C) Dox‐responsive HMGA2#1 and #2 shRNA‐expressing JHH‐4 cells incubated under Dox (+) or (−) conditions for 4 days and HuH‐7 cells stably expressing HMGA2 (HM) or the control (M) were analyzed by western blotting. The p27 and p‐p27(S10) band intensities quantified with ImageJ software are shown relative to the controls (Dox + or M) after normalization with the corresponding intensities of the loading control of β‐actin. The p‐p27(S10) intensities were also normalized with the p27 values and are shown in parentheses. (D) Cells were treated with pooled AKT1 and 2 or control (Ctr) siRNA for 3 days and analyzed as in (C). (E) JHH‐4 cells expressing the wild‐type (WT) and mutant (S10A)‐p27 were treated with CHX (100 μg/ml), and the p27 amount was quantified by western blotting using ImageJ software and plotted as in (A).
