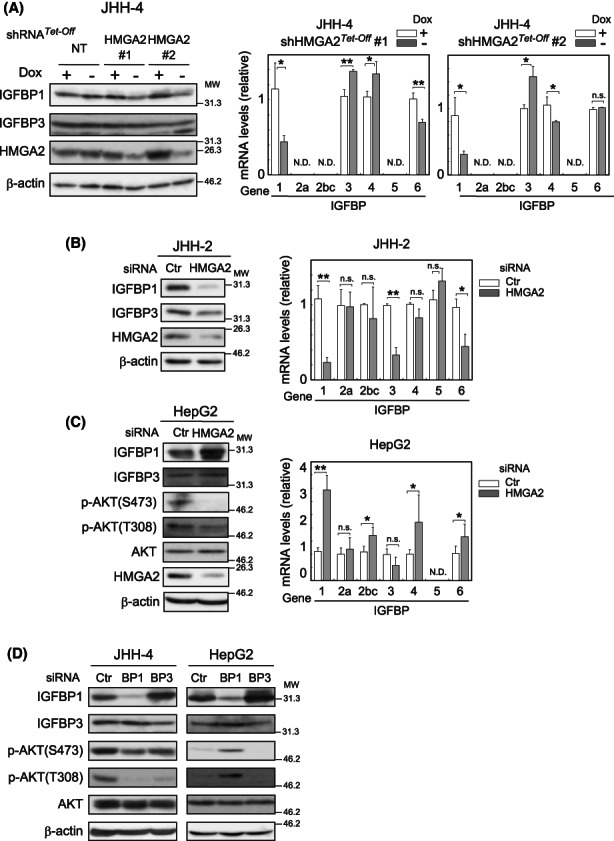
FIGURE 6.

HMGA2 Regulation of AKT activity via IGFBP1 expression. (A–C) Dox‐responsive shRNA HMGA2 #1 and #2‐expressing and the control (NT) cells incubated under Dox (+) or (−) conditions (A), or JHH‐2 (B) and HepG2 (C) cells treated with HMGA2 and the control (Ctr) pooled siRNA were examined by western blotting after 4 days and by qPCR after 3 days. β‐Actin, the loading control. The values represent the mean ± SD from triplicates and are shown relative to the control (Dox + or Ctr) after normalizing the corresponding values to TATA‐box binding protein. **p < 0.005; *p < 0.05; n.s., not significant. (D) Cells were treated with IGFBP1 (BP1), IGFBP3 (BP3), and control (Ctr) pooled siRNA for 3 days and analyzed by western blotting.
