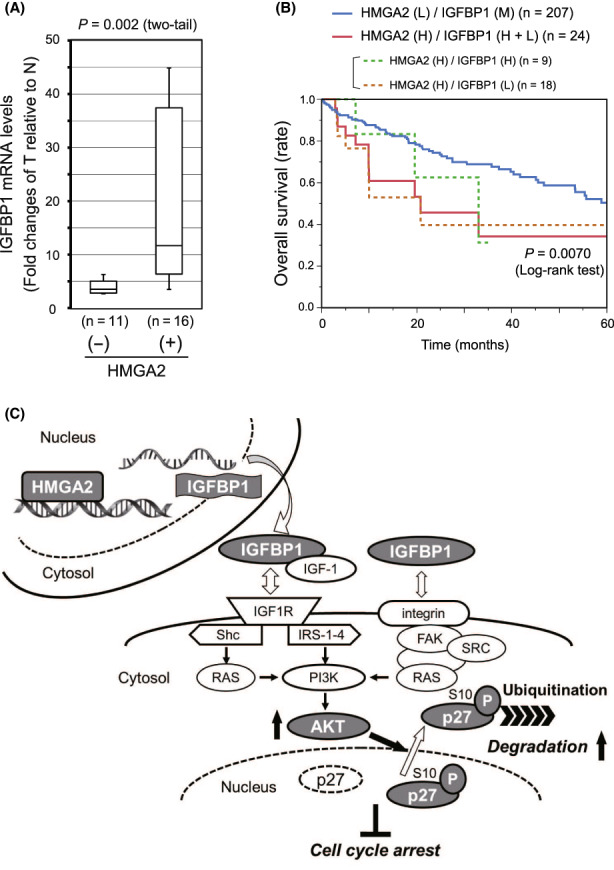
FIGURE 7.

HMGA2 and IGFBP1 expression, and patient prognosis in the hepatocellular carcinoma (HCC) cases. (A) IGFBP1 mRNA amounts were determined by qPCR in pairs of HCC tumor (T) and adjacent nontumorous (N) tissues obtained from patients (Table S1). After normalization with the nuclear‐encoded control mRNAs (Section 2), the fold change of the value in T relative to that in N in each pair was plotted in the group with HMGA2 amplification positive (+) and negative (−). The statistical significance of the differences was assessed by Mann–Whitney U‐test. (B) A Kaplan–Meier plot showing patients categorized by combined HMGA2 and IGFBP1 expression levels, was generated using the liver hepatocellular carcinoma dataset (TCGA, Firehose Legacy) in the cBioPortal (Section 2). HMGA2 (H), high (z‐score > 0); (L), low (z‐score < 0); IGFBP1 (H + L), high (z‐score > 1) + low (z‐score < −1); (M), median (−1 < z‐score < 1). (C) Schematic representation of the degradative regulation of p27 protein levels by the HMGA2/IGFBP1/AKT axis as a countermeasure against antiproliferative cyclin‐dependent kinase inhibitor (CKI) effects.
