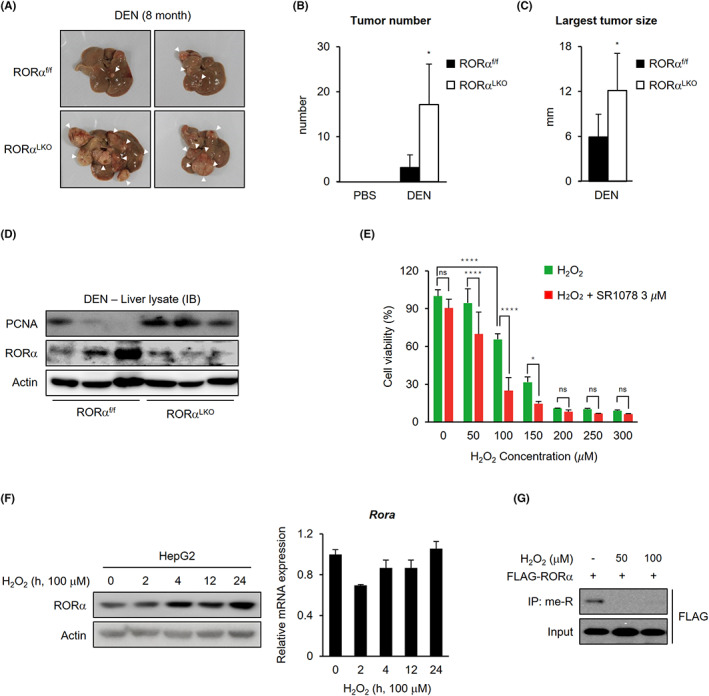
FIGURE 2.

Enhanced tumor formation in liver‐specific RORα null mice treated with damage signals. A, Representative images of tumor‐bearing livers from 8‐m‐old WT and RORα LKO mice treated with DEN. B, C, Bar graph for tumor number (B) and largest tumor size (C) in 8‐m‐old DEN‐treated WT and RORα LKO mice liver tissues. D, Western blot images of tumor‐bearing livers from 8‐m‐old WT and RORα LKO mice treated with DEN. E, HepG2 cells were plated into 96‐well plates, and after 1 d, cells were treated with H2O2 only or H2O2 plus 3 μM SR1078 at the indicated concentrations for 5 d. Cell viability was measured by CCK8 assay. F, RORα protein and mRNA levels in HepG2 cells after 100 μM H2O2 treatment for the indicated lengths of time. The protein and mRNA levels were normalized to β‐actin expression. G, Arginine methylated FLAG‐RORα levels in 293 T cells after 0, 50, and 100 μM H2O2 treatment for 6 h. Statistical analysis was performed using Student's unpaired t test for comparisons between two groups and two‐way ANOVA with Šidák's post hoc tests for multiple comparisons. *p < 0.05, **p < 0.01, ***p < 0.001, ****p < 0.0001. Data are expressed as mean ± SEM
