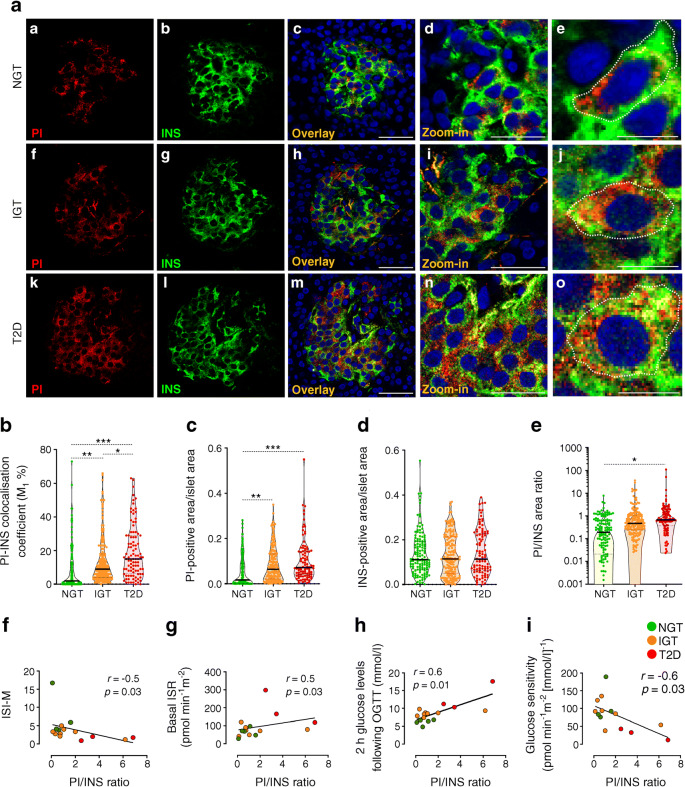
Fig. 2.
In situ proinsulin/insulin ratio and colocalisation rate are altered in pancreatic islets of IGT and type 2 diabetic participants. (a) Double immunofluorescence images showing the expression of PI (red) (panels a, f, k), INS (green) (panels b, g, l), DAPI (nuclei, blue) and overlay channels (yellow) (panels c, h, m) in frozen pancreatic tissue sections from NGT, IGT and type 2 diabetic participants. Scale bars, 50 μm. Digital zoom-in overlay images are reported in panels d, i and n; scale bars, 30 μm. High-resolution images of single beta cells of NGT, IGT and type 2 diabetic participants are reported in panels e, j and o; scale bars, 10 μm. Violin plot graphs showing PI–INS colocalisation rate (%) (b), PI-positive area (c), INS-positive area (d) and PI/INS area ratio (plotted on log10 axis) (e), measured in pancreatic islets (NGT n=131; IGT n=168; type 2 diabetes n=97) of n=5 NGT, n=9 IGT and n=5 type 2 diabetic participants. *p<0.05, **p<0.01, ***p<0.001, one-way ANOVA and Tukey’s multiple comparisons post hoc test. Correlation analysis of in situ PI/INS area ratio with ISI-M (r=−0.5, p=0.03) (f), basal ISR (r=0.5, p=0.03) (g), 2 h glucose levels at OGTT (r=0.6, p=0.03) (h) and glucose sensitivity (r=−0.6, p=0.03) (i). Correlations included all participants with available metabolic/clinical measures. p and r values were obtained using Spearman correlation test. INS, insulin; PI, proinsulin; T2D, type 2 diabetic

