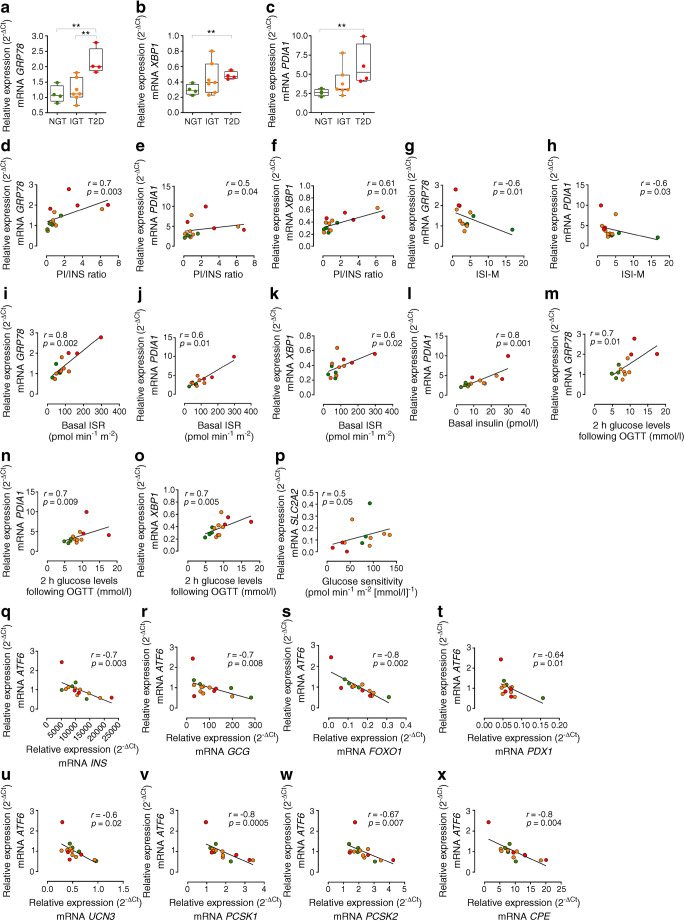
Fig. 3.
ER stress is associated with proinsulin/insulin expression and processing defects and with in vivo metabolic derangements. Real-time PCR expression analysis of GRP78 (a), XBP1 (b) and PDIA1 (c) in pooled LCM pancreatic islets of n=4 NGT, n=7 IGT and n=4 type 2 diabetic participants. **p<0.01, one-way ANOVA and Tukey’s multiple comparisons post hoc test. (d–p) Graphs showing the correlation analysis in pancreatic islets of NGT, IGT and type 2 diabetic participants of GRP78 (d), PDIA1 (e) and XBP1 (f) with PI/INS area ratio; GRP78 (g) and PDIA1 (h) with ISI-M; GRP78 (i), PDIA1 (j) and XBP1 (k) with basal ISR (pmol min−1 m−2); PDIA1 (l) with basal insulin (pmol/l); GRP78 (m), PDIA1 (n) and XBP1 (o) with glucose levels 2 h after OGTT (mmol/l); and SLC2A2 (p) with glucose sensitivity (pmol min−1 m−2 [mmol/l]−1). (q–x) Correlations of ATF6 expression in pooled LCM pancreatic islets of NGT, IGT and type 2 diabetic participants with INS (q), GCG (r), FOXO1 (s), PDX1 (t), UCN3 (u), PCSK1 (v), PCSK2 (w) and CPE (x). Green, NGT participants; orange, IGT participants; red, type 2 diabetic participants. Correlations included all participants with available metabolic/clinical measures and a valid RIN (≥5.0). For correlations, p and r values were obtained using Spearman correlation test. INS, insulin; PI, proinsulin; T2D, type 2 diabetic

