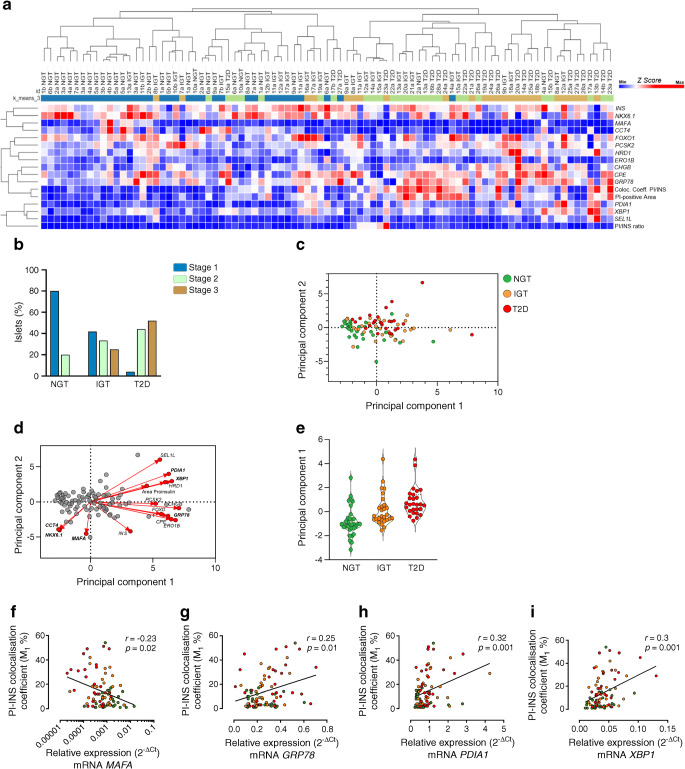
Fig. 4.
Analysis of individual human pancreatic islets reveals a direct association between proinsulin processing, ER stress and beta cell dysfunction during in vivo metabolic alterations. (a) Hierarchical clustering analysis of genes associated with ER stress, beta cell function and proinsulin/insulin in situ staining variables of individual pancreatic islets of n=3 NGT, n=3 IGT and n=3 type 2 diabetic participants. Colour key indicates z score values from the least expressed (dark blue) to the most expressed (dark red). (b) Histogram graph showing individual islet staging classification based on k-means clustering (n=3) values, which discriminates the individual islet profiles into three different progression stages (Stage 1 [normal], Stage 2 [intermediate dysfunction], Stage 3 [full dysfunction]; blue, green or brown colour coded, respectively). (c) PCA plot shows three clusters of analysed samples in which the individual islets are represented by green (NGT), orange (IGT) and red (type 2 diabetes) and projected into a 2D space (components 1 and 2). (d) PCA biplot showing principal component scores and loading values, which determine most of the directionality of individual islet progression based on the set of evaluated markers. (e) Graph showing principal component 1 values which determine the individual islet progression exclusively based on the following markers: MAFA, NKX6.1, CCT4, PDIA1, XBP1, GRP78. (f–i) Correlations of beta cell identity gene MAFA (f) (plotted on log10 axis) or ER-related genes GRP78 (g), PDIA1 (h) and XBP1 (i) with immunofluorescence in situ PI/INS variables. NGT participants, green; IGT participants, orange; and type 2 diabetic participants, red; p and r values were obtained using Spearman r test. INS, insulin; PI, proinsulin; T2D, type 2 diabetic

