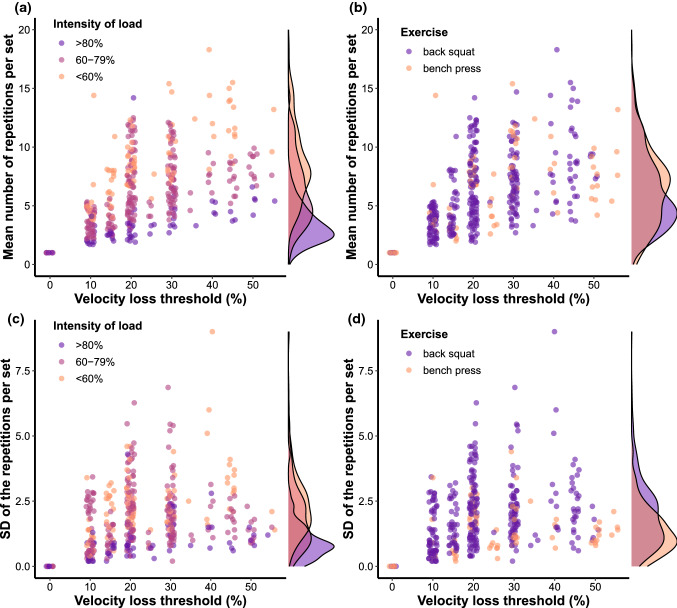
Fig. 3.
Visual representation of the mean number of repetitions performed per set by intensity of load (a) and exercise (b), as well as standard deviation of the number of repetitions performed per set by intensity of load (c) and exercise (d) across the velocity loss thresholds reported in the literature. Note, longitudinal studies were also included here when they reported number of repetitions per set for each training session. Note, one study outlier was removed from the figure as the participants completed more than 25 repetitions in a set

