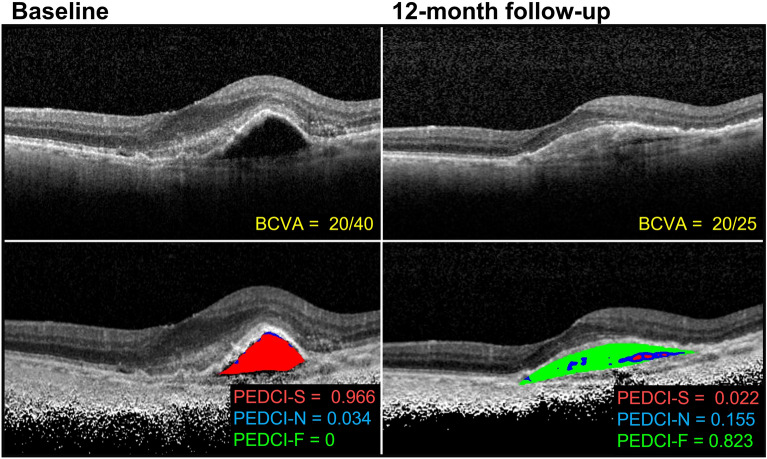
Figure 6.
Optical coherence tomography images from a patient with neovascular age-related macular degeneration at baseline and 12-month follow-up. Baseline images are treatment naïve. The patient received six intravitreal aflibercept injections before the 12-month visit. Best-corrected visual acuities (BCVA) are reported along with calculated PED composition indices: serous (PEDCI-S), neovascular (PEDCI-N), and fibrous (PEDCI-F). Classified areas include serous (red), neovascular (blue), and fibrous (green) components of the PED.

