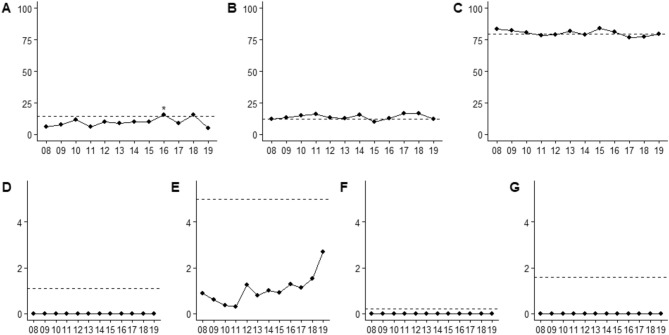
Figure 3.
Ethnicity and Race Trended Between 2008–2019. Median proportions (%) of Hispanics (N = 1062) and race categories (N = 1589) by year, with the x-axis representing the year (2008–2019) and the y-axis the ethnicity/race proportion (%). (A): Hispanics, *P < 0.05 (Wilcoxon rank sum test comparing annual proportion relative to 2008 clinical trial proportion); (B): Blacks; (C): Whites; (D): American Indians and Alaskan Natives; (E): Asian; (F): Native Hawaiians and Pacific Islanders; (G): Multiracial individuals. The dashed line represents the designed demographic proportion from Census 2010.

