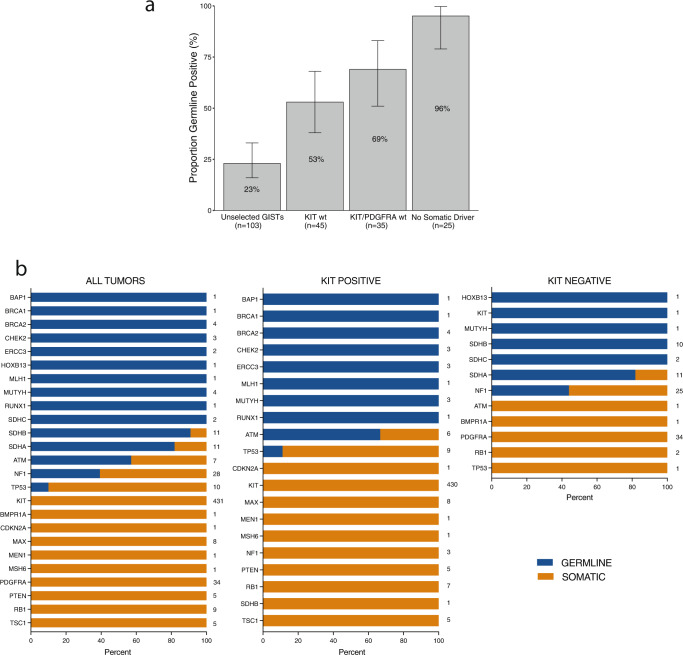
Fig. 2. Detection of germline P/LP variants in GIST patients based on somatic profiles.
a Proportion of patients with P/LP variants in GIST-associated genes in the cohort of 103 patients who received germline genetic testing. Percentages are plotted and displayed on the bar graphs. Error bars represent confidence intervals calculated by the Clopper-Pearson method. b Distribution of germline (blue) and somatic (orange) P/LP variants detected in tumor-only sequencing analysis of de-identified GISTs from 499 patients. Data from all tumors (left), KIT-mutant tumors (middle), and KIT-wildtype tumors (right) are presented. Numbers displayed on the right of each gene data on each plot represent the number of tumor samples with variants identified in each gene in that group of tumors.

