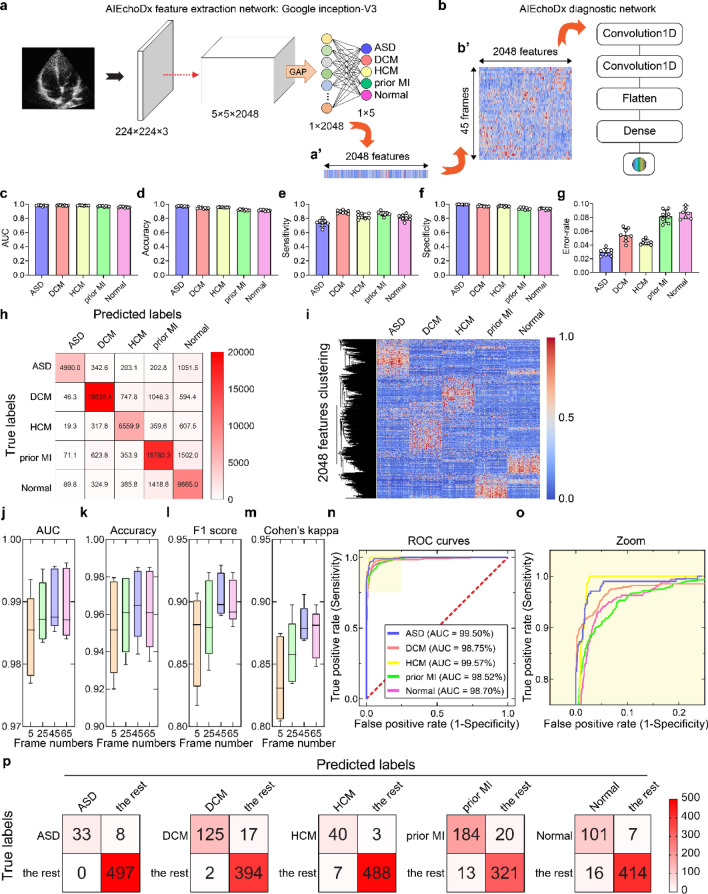
Figure 2.
Performance of AIEchoDx. (a) Structure of feature extraction network; (a’) represents a heatmap of the features of one image extracted from the last hidden layer. (b) Structure of the diagnostic network; (b’) represents a heatmap of the feature matrix of a 45-frame echo video as an input of the diagnostic network. (c–g) The AUC (c), accuracy (d), sensitivity (e), specificity (f), and error-rate (g) values of the eightfold cross-validation results of the feature extraction network. (h) Confusion table displays the eightfold cross-validation results of the feature extraction network classified five categories from the test dataset 1. (i) The clustered heatmap illustrated 2048 features were extracted from the last hidden layer of the feature extraction network. 50 single frames from each category were selected from 50 patients for plotting the heatmap. (j–m) The frame number versus the values of matrix accuracy (j), F1 score (k), Cohen’s kappa (l), and AUC (m) of cardiac diseases and normal subjects from the diagnostic network. The diagnostic network reading a 45-frame video could achieve the best performance of the prediction in test dataset 1. (n,o) Receiver operating characteristic (ROC) curves of the 45-frame diagnostic model from test dataset 1 (The AUC values of ASD, DCM, HCM, prior MI, and Normal were 99.50%, 98.75%, 99.57%, 98.52%, and 98.70%, respectively). (p) The confusion matrices represent the prediction results of the five classifiers for test dataset 1.

