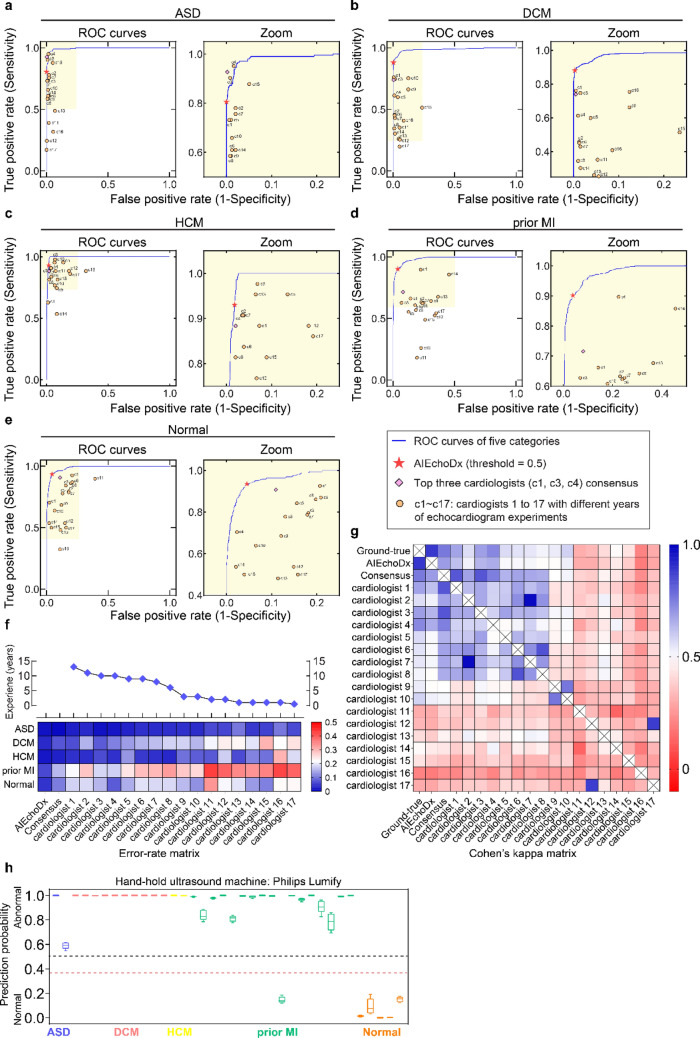
Figure 3.
Diagnostic performance comparison between AIEchoDx and physicians. (a–e) ROC, and zoomed curves for comparing the performance on diagnosing ASD in (a), DCM in (b), HCM in (c), prior MI in (d), and Normal in (e) among AIEchoDx and seventeen human experts, respectively. The results were calculated from the 538 videos from 538 independent patients in test dataset 1. The red asterisk denoted the performance of AIEchoDx; the filled diamond with purple color denoted the performance of the consensus of three best-performed cardiologists (c1, c3, and c4); while the filled circles with orange color denoted the performance of seventeen physicians (cardiologists 1–17). (f) The error rate matrix of AIEchoDx and the seventeen physicians with distinct training experiences of echocardiogram for each of the five categories. The blue diamonds connected with the black line marked the training years for physicians. (g) Cohen’s kappa coefficient matrix of AIEchoDx, the expert consensus, and the seventeen physicians. The Cohen’s kappa coefficient matrix of each category has been shown in Fig. S7. (h) Prediction probabilities of ASD, DCM, HCM, and prior MI patients and Normal subjects taken by Philips Lumify. The black line represents a threshold of 0.50 and the red line represents a prediction threshold of 0.35 (abnormality detection).

