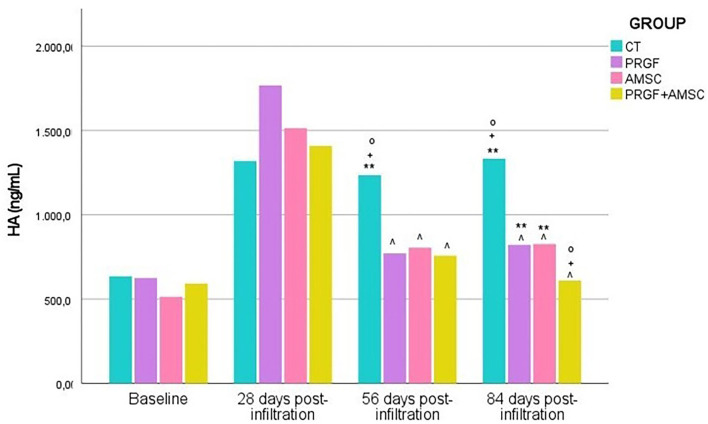
Figure 4.
HA serum levels (ng/mL) before infiltration and 28-, 56-, and 84-days post-infiltration in all treatment groups. HA, hyaluronic acid; CT, control; PRGF, plasma rich growth factors; AMSCs, adipose mesenchymal stem cells; PRGF + AMSCs, combination of plasma rich in growth factors with adipose mesenchymal stem cells. ∧, significant differences with CT group; °, significant differences with PRGF group; +, significant differences with AMSCs group; **, significant differences with PRGF + AMSCs group.

