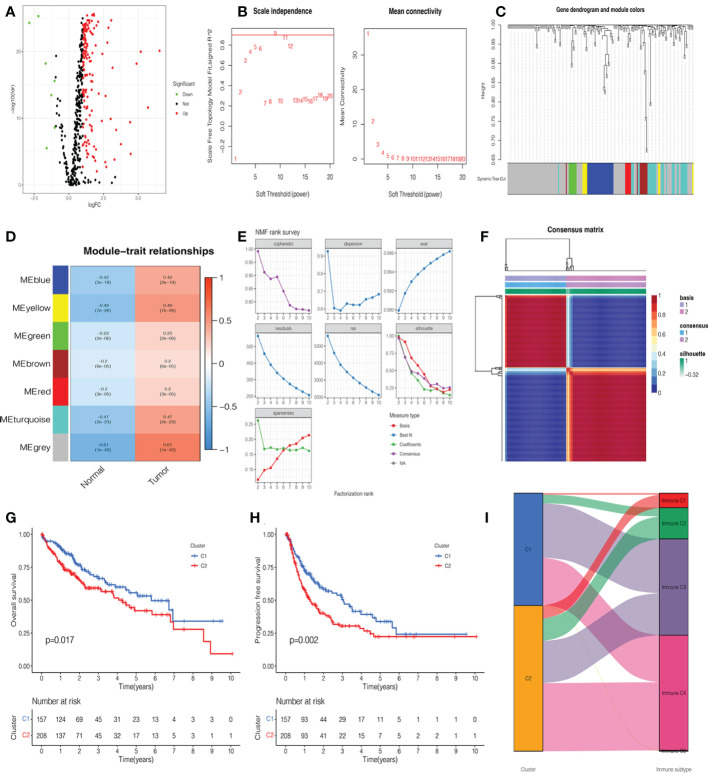
Figure 2.
Identification of glycosylation-related differentially expressed genes (DEGs), functional modules, and molecular subtypes. (A) Volcano plot of 201 glycosylation-related DEGs in hepatocellular carcinoma (HCC). (B) The distribution of the scale-free topology model fit and the trends of mean connectivity. (C) The hierarchical clustering analysis presented similar characteristics with the same color by a dendrogram. (D) The correlation between the trait and each module in HCC and normal tissues. (E) Non-negative matrix factorization (NMF) survey analyzed the factorization rank, including cophenetic, dispersion, evar, residuals, rss, silhouette, and sparseness coefficients. (F) Heatmap of two clusters of HCC. Kaplan–Meier (K-M) curves of overall survival (OS) (G) and progression-free survival (PFS) (H) in two clusters of patients with HCC. (I) The association between clusters and immune C1, C2, C3, and C4.

